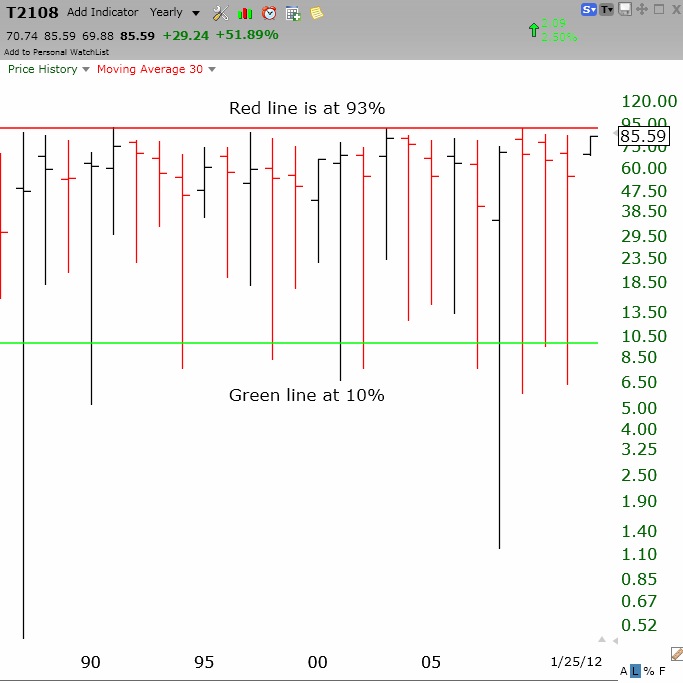
Some QQQ short term up-trends have lasted as long as 80 days. However, one warning sign that this market is getting frothy is that the T2108 is at 86%. While the T2108 indicator can remain at this overbought level for a few weeks, it nevertheless is near the highest level that it reaches. The yearly chart below shows the range of the T2108 since its inception in 1986 by the Worden Group. The red and green horizontal lines show the typical extreme levels that have been reached. In 1987 and 2008 the T2108 reached into rare single digit territory below 5%. At the other extreme, there are a few years when the T2108 has reached close to 93%. The current reading near 86% is therefore relatively rare. I become cautious as the market approaches the red line and wish I had the courage to become bullish when it reaches the green line. The trouble is that when the T2108 approaches single digits, the news is terrible and the markets are in a panic phase. If I follow the GMI and am in cash, it is easier, but not easy, to buy when the market is extremely oversold. By the way, the T2108 measures the percentage of NYSE stocks that closed above their simple average of their closes of the past 40 days. T2108 is updated each day as part of the Worden charting program. Click on chart to enlarge. To me, the T2108 is an excellent pendulum of market sentiment.
If you chart this indicator on a daily chart and overlay the spy or sp-500 it appears to show that “tops” are often times early, sometimes by a few months. But,it can be a good early warning type indicator.
It appears to work better at market bottoms, but again no indicator is perfect.