Well, the market has clawed itself back up to critical technical resistance levels. The SPY and DIA have closed back above their 10 week averages, but the QQQ closed just below that level. A close of QQQ above 57.06 would give me a buy signal. I have repeatedly found that I can trade growth stocks profitably only when the QQQ remains above its 10 week average. The GMI has come back to 4, a level at which I start to feel comfortable going long. Of note, the IBD Growth Mutual Fund index is now above its 50 day average. Nevertheless, IBD still considers this market to remain in a correction. There have just been no large volume up-days in the major indexes. 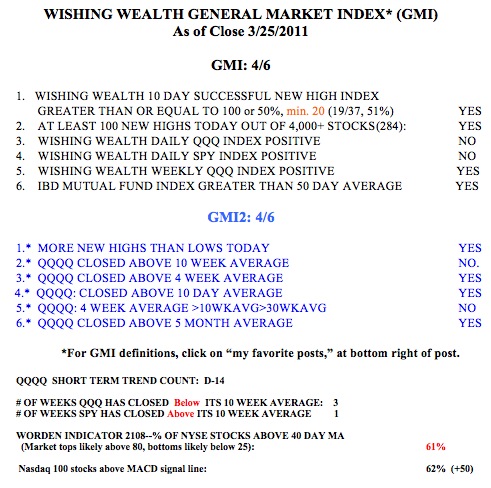 My SPY and QQQ daily indexes also are still negative. (Click on table to enlarge.) The QQQ completed the 14th day of its short term down-trend on Friday. A little strength on Monday and Tuesday could bring that index into a new short term up-trend. It is noteworthy that 62% of the Nasdaq 100 stocks closed with their daily MACD above its signal line, a sign of short term strength. And the Worden T2108 indicator is now at 61%, in neutral territory.
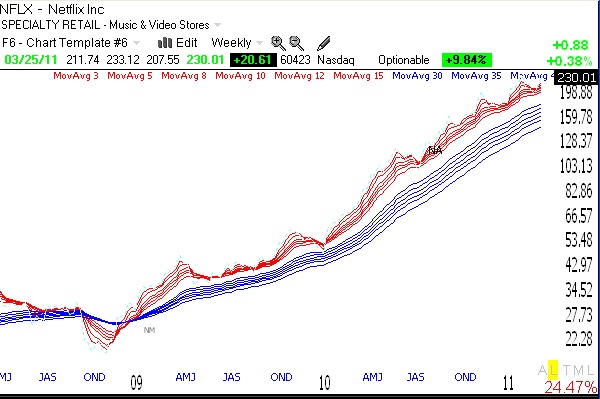
During the current QQQ short term down-trend, a few Nasdaq 100 stocks have shined. Since March 8, the following stocks in this index rose the most: NFLX (+17.7%), BIDU (+12.3%), WFMI (+9.8%), SBUX (+8.5%) and DLTR (+6.8%). If the QQQ begins a new short term up-trend, these stocks may lead the rise.
As this weekly chart shows, NFLX has been in n RWB rocket stock pattern for over two years.
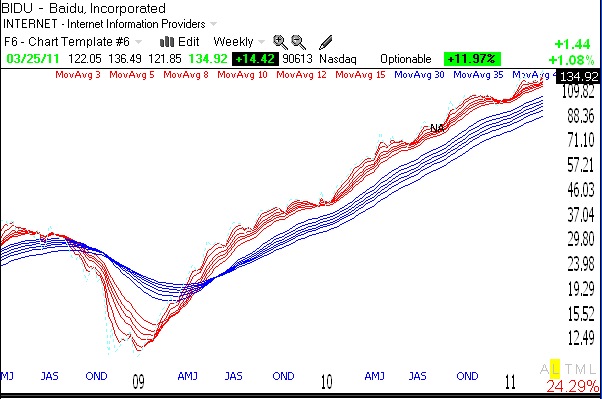
And BIDU:
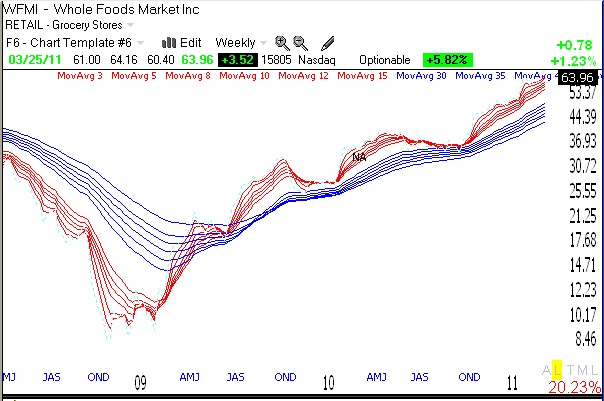
And WFMI:
And SBUX:
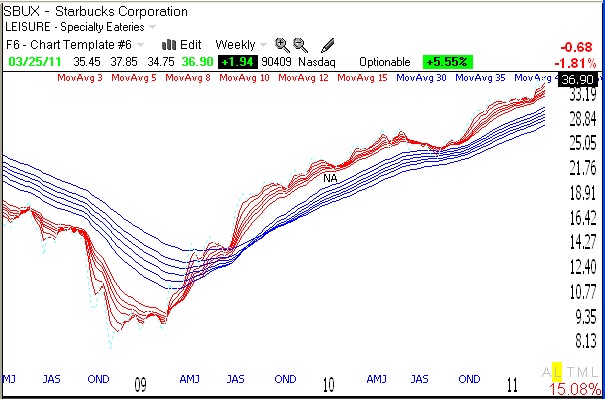
Perhaps I should just buy RWB stocks and ride them until the short term averages (red) fall below the longer term averages (blue).
Like CAAS:
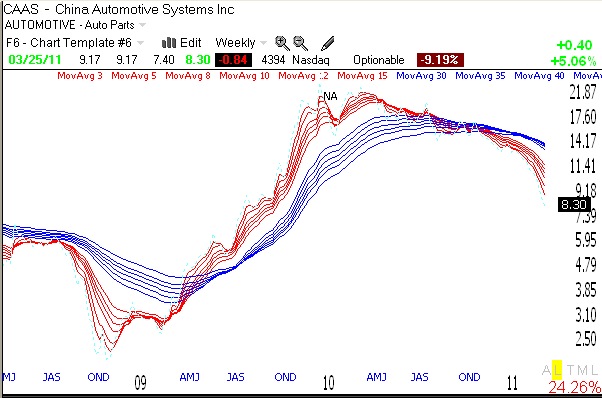
Get the picture? Just ride the RWB stocks up and exit and/or short the BWR stocks on the way down.
In today’s post,you said that QQQ has not yet closed above 10-week moving average. However, stockcharts shows that QQQ has closed above 10-week simple and exponential moving averages. Why?
Just observing,
it looks like the market might roll over today and into tomorrow. This extreme bounce might be running out of steam. I would stay defensive on the long side.
To John’s Question: Make sure you are getting a 10 week MA of your price and not of some other indicator on your price history chart.(ie. ANother moving average)
My 10 week on the QQQ is showing that it is below the MA.