I am posting this message with great trepidation.
In my post written on June 8, 2008, I wrote:
“The major bank stocks look especially weak.
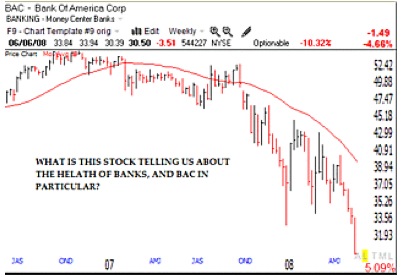
Look at this weekly chart of Bank of America (red line= 30week average; click on chart to enlarge). Other bank stocks with similar charts include : WB, UBS, STI, and DB. When major bank stocks are in a free-fall, can the rest of the market be far behind?”
At the time I wrote this post in 2008, BAC closed at $30.50 BAC bottomed out eight months later in February of 2009, at $2.53 along with the rest of the fallen bank stocks…….
This weekend, I happened to notice that even though the market rose on Friday, there were 116 new 52 week lows in my universe of 4,000 stocks, the most since August 31, 2010. Since then, there was only one other day when there were more than 100 new daily lows! Given this unexpected number of new lows on Friday, I sorted them by industry group and was struck by the fact that all but a handful of these new lows came from the municipal bond sector. When I examined the weekly charts of these stocks I found a uniform pattern similar to that shown by the bank stocks in 2008, as they began their horrific descent.
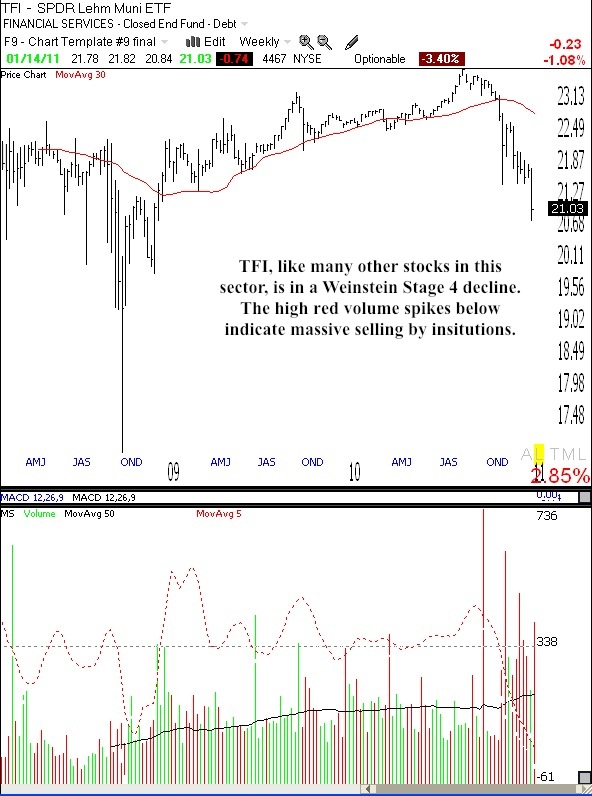
Rather than show you a large number of individual charts, I present below the chart of the SPDR Nuveen Barclays Municipal Bond Fund (TFI) which tracks an index reflecting the US municipal bond market. (TC2007 lists the former name of this ETF.) Click on chart to enlarge. This chart is a classic Weinstein Stage 4 pattern (see his book to lower right) which indicates a major decline. Most significant is the high red volume spikes, suggesting massive selling by institutions.
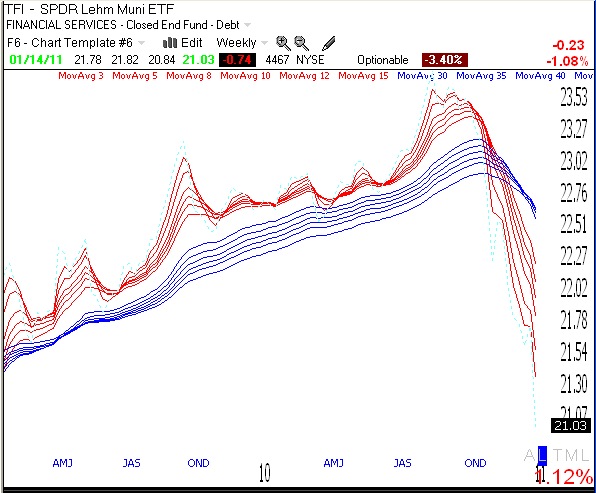
Below is my standard weekly GMMA chart, another indication that TFI is in a major down-trend, with all of the short term averages (red lines) below the declining longer term averages (blue). The bearish pattern (BWR) is the opposite of the bullish RWB rocket stock pattern, and is more like what I call a submarine pattern.
Now, I would not be sounding the alarm if this were the pattern of only TFI. Just examine the weekly chart of any of the many municipal bond ETF’s that hit a new low on Friday, for example: NIF, MYN, VKQ, PZA, MLN……………..
In her recent interview on 60 Minutes, business analyst Meredith Whitney, who correctly predicted the sub-prime mortgage crisis, warned of the impending municipal bond collapse. I recommend that you listen to her interview. As you might expect, not everyone agrees with Meredith’s estimates of the degree of damage to the economy that will result. On the other hand, as a technical analyst, I act on what the market behavior tells me, not what people opine. And my reading of these charts is that the full scale exit from municipal bonds has begun. As I said above, when I saw the bank stocks declining in 2008, if this decline persists, can the rest of the market be far behind?
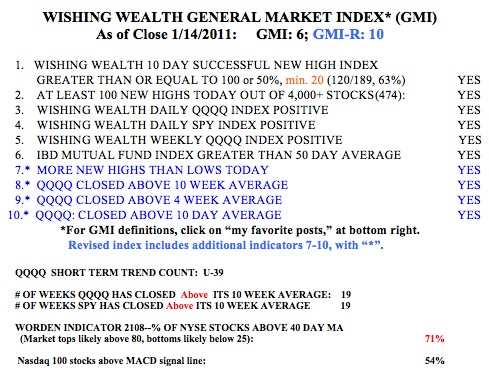
It may be time for me to take most of my profits off of the table and to prepare for the worst. I am glad I do not own any municipal bonds, but maybe my bank or mutual funds do? I hate to write this when the GMI and GMI-R are so strong, but the decline could come suddenly, when we reach the tipping point. What do you think?
I wrote the above before the news came out about Steve Jobs. The magnitude of the reaction of AAPL (and other tech stocks) to the news could give us an idea of whether the market is on shaky ground. The GMI and GMI-R are at their maximum levels, but remember that these indicators only detect a change in trend after it has occurred. Such is the fate of trend following indicators. One other indicator that is flashing a warning sign is the low percentage of bears in the Investor’s Intelligence poll–only 19.1%. This is a contrary indicator and such low percentages of bears tend to occur near market tops when almost everyone is bullish.
Thanks for this Dr. Wish.
Dr. Wish-
I am unable to short stocks in my Roth IRA, so I was wondering if you knew of any Muni Bond ETF’s that worked against the market, so that I can go long on these in anticipation of the municipal bond collapse.
Thanks for the great post! I remember last time bad news about steve jobs came out I was in your class and apple went under 100$. Shaun ended up winning stock trak from going long in apple.
Dr. Wish, thanks for the great article. what i heard is that with the muni crisis looming, people are betting that QE3 will come to rescue therefore they just keep buying equity. I think many are thinking that Fed will simply back stop anything at any cost.
I noticed the same aberration in number of new lows for NYSE and most were muni bond funds. Although technically everything looks OK but I pushed the sell button this AM and except for a few biotechs with outstanding fundamentals and great technical charts I am going to step aside–it may be 6 days or 6 weeks but a huge correction is coming and the institutions (smart money) are defensive and have been selling into this current rally. I am a newbe registered investment advisor (age 68) so I may be too conservative but I was fortunate enough to sit out of the severe decline of 20008 and early 2009 very comfortably in a few gold stocks and 95% treasuries. As a former ENT surgeon I would say this market has bad breath. I admire your blog greatly and appreciate your willingness to share your perceptions with such candor. Paul I Wills MD
Dr. Wish,
A good article:
http://pragcap.com/putting-the-muni-bond-panic-into-perspective
Thanks. Enjoy your work very much.
Y follow your blog already many, many years.
Your advice is always prudent and very wise and for me THE BEST OF THE ENTIRE WEB!!
Thank you!
🙂
if money leaves muni bonds, it will go someplace.
perhaps equities and therefore giving another boost to the stock market?
perhaps corp bonds, perhaps gov’t bonds?