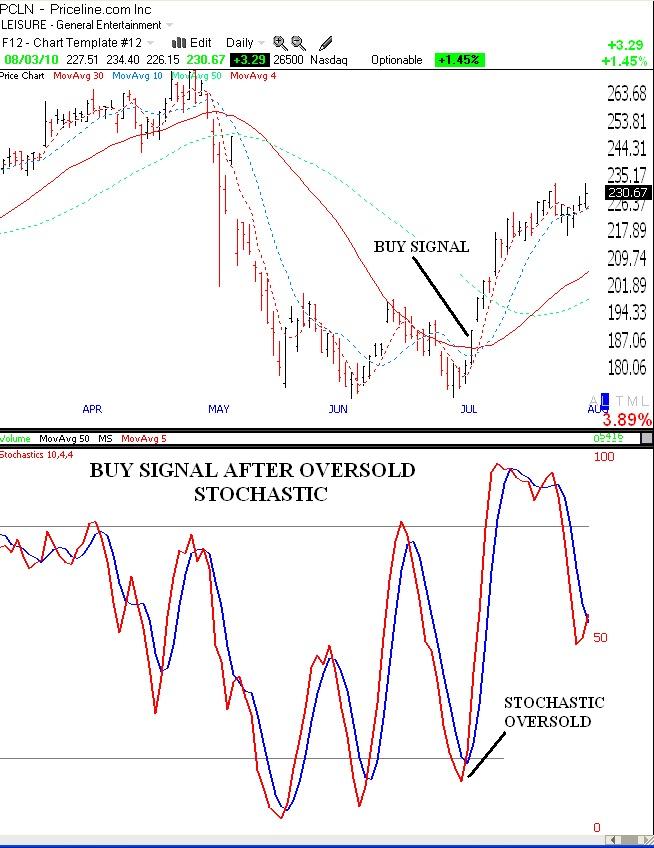
I have been talking about the scan that I use to detect stocks with an oversold stochastic that then go on to produce a buy signal. While I did not buy PCLN when I saw this signal because of the low GMI reading, I did notice PCLN when my scan detected it weeks ago. This is of some note, because PCLN exploded after hours on Tuesday when it released its blow-out earnings. The chart below shows why my scan detected PCLN (click on chart to enlarge). Within a few days after its stochastic declined to oversold levels, below 20, PCLN closed above its 30 day average, indicating a buy signal for me. You can see for yourself what happened next. This scan does not typically work so well in a down market, but I have found that in an up-trending market it can work quite well. In the coming days I will list some stocks that are picked up by my scan. Just remember, no technique is perfect and one must always use stops to minimize losses.