I have been watching TRLG for a while. It came to my attention when it hit a 52 week high a few weeks ago. I went to its monthly chart (click on chart to right) and saw that the stock has two promising characteristics. First, it was about to break its all-time high. TRLG reached a high of 31.82 in September, 2008, just before the market began its swoon. This maker of high priced jeans was probably hurt by the coming recession but may do well as affluent consumers spend again. 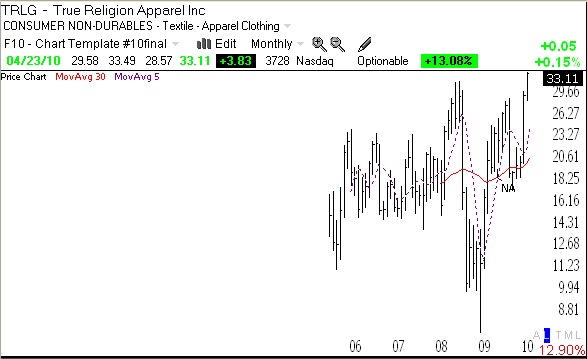 Second, TRLG is a recent IPO, having come public in 2005. My students should remember that William O’Neil has said to look for great stocks among those that have come public in the last 8 years or so. The “NA” on the chart indicates that IBD wrote about TRLG in its New America column last summer–another plus. So, TRLG got my attention as it approached its all-time high. It has fought back from a low of 7.80 in March, 2009. When a stock can regain all of its lost ground and push to an all-time high, I become very interested. And last week TRLG did that, closing at 33.11. The only thing that was missing was unusual high volume when it broke out. The other potential problem is that earnings are coming out on May 4th. Maybe the stock is rising because insiders know earnings will be great, or maybe the company will miss and the stock will dive. TRLG has a short ratio of 11.7 and it could really rise if the shorts have to cover. I have bought some May call options on TRLG and am betting on a rise. I really like stocks that can push through to an all-time high. (I posted about AAPL weeks ago.) If I am wrong and TRLG comes back down, the most I can lose is the cost of the calls. If I am right, I GES you may call me a jeanius!
Meanwhile the GMI and GMI-R remain at their maximum readings.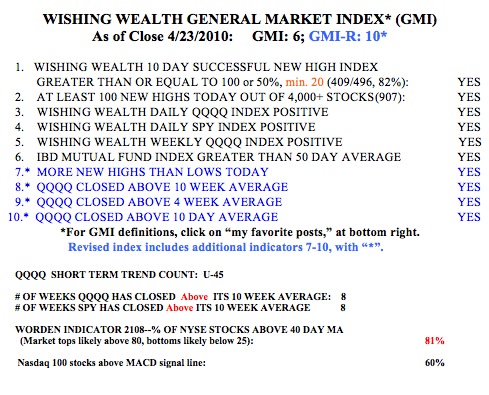 Friday was the 45th day of the current short term up-trend in the QQQQ. QQQQ has not closed below its 10 day average since last February. This has been an amazing and rare up-trend. Both the SPY and QQQQ have closed above their 10 week averages for 8 weeks. The Worden T2108 Indicator remains at a high level, at 81%. T2108 has been above 77% since March 5th. This indicator acts like a pendulum of the market. The market tends to hit tops around 90% and bottoms below 20%, but not always. Anyway, with the up-trend in place I remain fully invested in my university pension and have been trading individual stocks and options in my IRA. The scan I talked about in the Worden webinar and the TC2007 scan I posted last week has helped me to find some promising stocks.
Dr. Wish, in light of today’s significant sell off, can you please update the GMI and GMI-R?
I see that the QQQQ closed below the 10 day for the first time since February 10th. IBD has also changed its market pulse to “Uptrend Under Pressure.”
Have a nice day for you!thank you for your good blog.
I had bookmarking this page and wiill sharing it with my friends.
true religion jeans outlet glad to see so good ideas.Keep working, great job, I love it!
this blogcheap true religion jeansH that is good.Thanks!
true religion jeans Thanks for sharing, I found this article,
while surfing for some downloads and ran across this website, thoughtful comments and good points made.
mens women jeans Thanks for posting this informative article.