I am writing this post primarily to teach my students how I search for potential rocket stocks–stocks that have been launched and appear headed towards new peaks. As I said in class this week, it makes the most sense to buy stocks that have the best fundamentals and technicals. This strategy has been advocated both by Nicolas Darvas and William O’Neil in their extraordinary books (listed at lower right of this blog). Darvas, made a fortune trading in growth stocks in the late 19050’s and said that he liked to buy stocks that were trading at all-time highs and that had already doubled in the past year. So, I am going to show you how I use the great TC2007 stock charting and analysis program to find potential rocket stocks that I research further before buying.
Nicolas Darvas
Some new rocket stocks to watch
I used TC2007 to scan the market for stocks that meet my most stringent fundamental and technical criteria for rockets. These stocks have great fundamentals and technicals, have already doubled their price a year ago and are near 5 year or all-time highs. I have listed in this table the 11 stocks out of 4,000 in my stock universe that met these criteria. 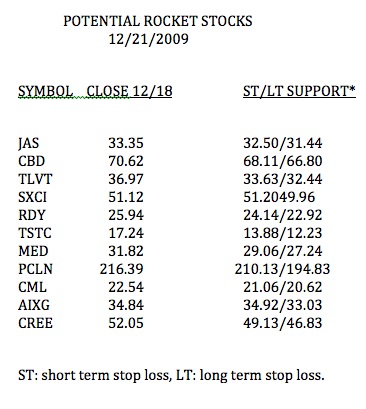 All of these stocks had last quarterly earnings up at least 100%. Coincidentally, all but 4 of the 11 are in my records as having appeared on the IBD100 and/or IBD New America lists during the past year. I have also noted in this table where I might place long term or short term stop losses on each long position. The most conservative stop loss is the short term support level. With a growth stock I rarely retain a long position if the stock closes below its short term support level. However, if I bought near long term support I might use the LT support level as my exit strategy. I will return to these 11 stocks in a future post to show you how they behaved. These stocks have already proven themselves as being in strong up-trends, but one never knows when an up-trend will end. That is why I immediately enter a sell stop or buy a put option for insurance, after buying one of these high momentum stocks. I currently own 3 of these stocks.
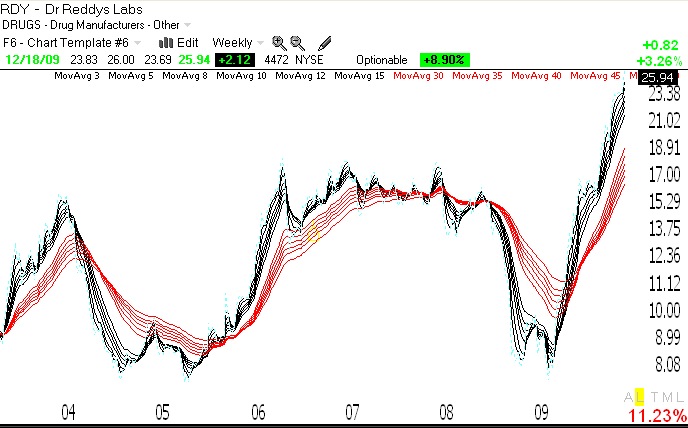
Below is a Guppy Multiple Moving Averages (GMMA) weekly chart (click on chart to enlarge) of one of these rocket stocks, RDY. Note how all of the shorter term averages (black lines) are well above the rising long term averages (red lines). This is the type of technical strength I seek in a potential rocket stock.
Meanwhile, the GMI and GMI-R remain at their maximum levels.
Stage 2 bullish up-trend in sight; Some Darvas type stocks to watch
The market held by the end of last week and I am getting more bullish. This is because we appear to be at the beginning of a significant turn up in the QQQQ. According to Weinstein’s stage analysis, the QQQQ is beginning a Stage 2 up-trend, as shown by the fact that its 30 week average is now starting to curve up. This is the sine qua non (I went to Boston Latin School) of a bull move. Weinstein’s stage analysis (note his classic book, to the lower right) is the most important way for me to determine the trend of individual stocks and the general market. By staying out of the market during aStage 4 declines (like the one we just finished) one can put the odds in favor of one’s portfolio’s long term growth. The GMI, which includes this measure from stage analysis, remains at 4 (of 6).