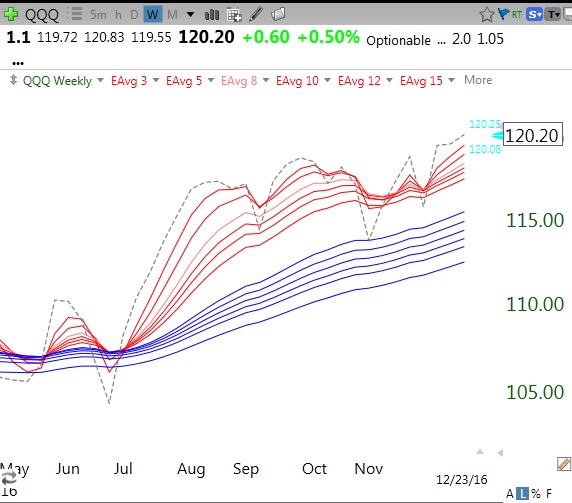
For a long time I have thought that my adapted Guppy charts composed of 13 weekly moving averages provide an excellent method for identifying stocks in a significant up-trend. Six of the exponential averages are red (3,5,8,10,12,15) and 6 longer term averages (30,35,40,45,50,60) are blue. When all the red averages are rising above the blue averages such that there is a white space between them, this constitutes a red white and blue (RWB) up-trend. I also add a 13th average (1) as a dotted line which shows the closing price each week. When all 13 averages line up with each shorter average rising above the next one (1>3>5>8……..60) this constitutes a really strong up-trend. I have created a new indicator that counts the number of averages that are rising above each longer average. The indicator, called the RWBCount, goes from 0-12. This indicator can be applied to both ETFs and individual stocks and in the future I will often provide the RWBCount. Below is a weekly chart of the QQQ, which has an RWBCount=12. Note that each line is above the next one. The RWBCount for DIA=12 and the SPY=12. So right now all 3 indexes are in very strong RWB up-trends.
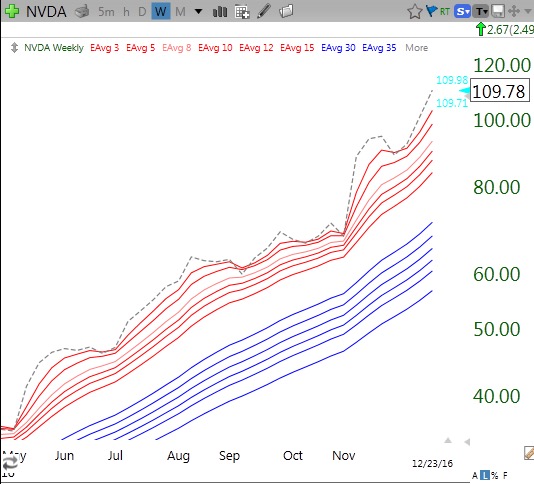
NVDA has an RWBCount=12 and has been 11 or more for months. Note how weekly price leads all of the averages up.
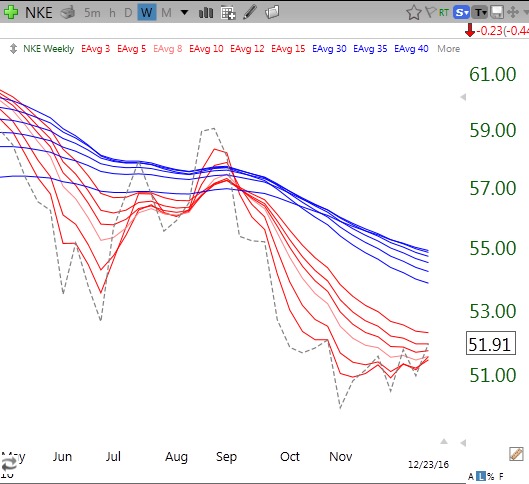
There is no way to know when an RWB pattern will end. I strive to hop on stocks with an RWBCount=11 or12 when they bounce up off of support and ride them until the trend ends. By the way, 60% of the Dow 30 stocks have an RWBCount=12. The current Dow dogs are: PFE (5), WMT (5), KO (3) NKE (2). Here is what a “2” looks like.
And a stock not in the Dow, GILD= “0”
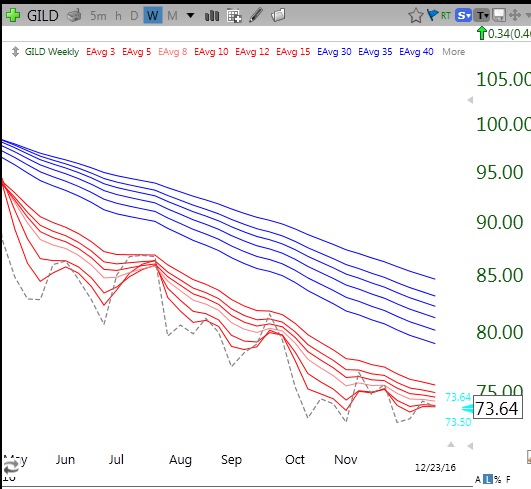
Get the picture–I call such stocks BWR or submarine stocks and consider them for shorting…
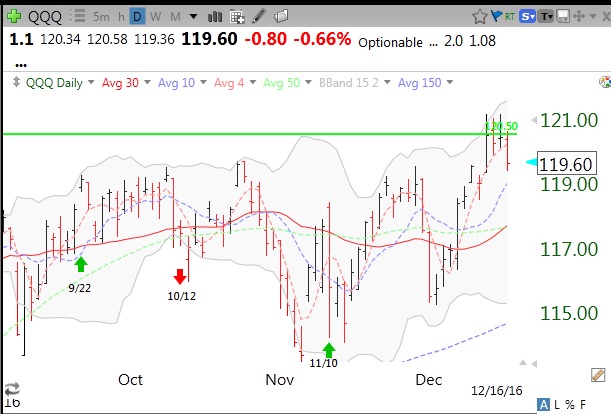
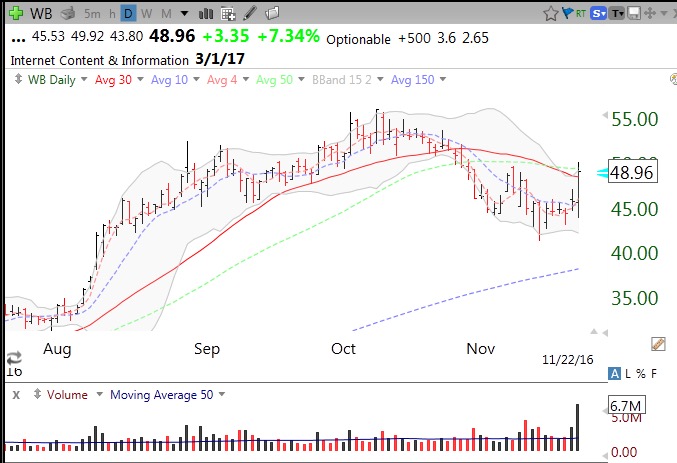
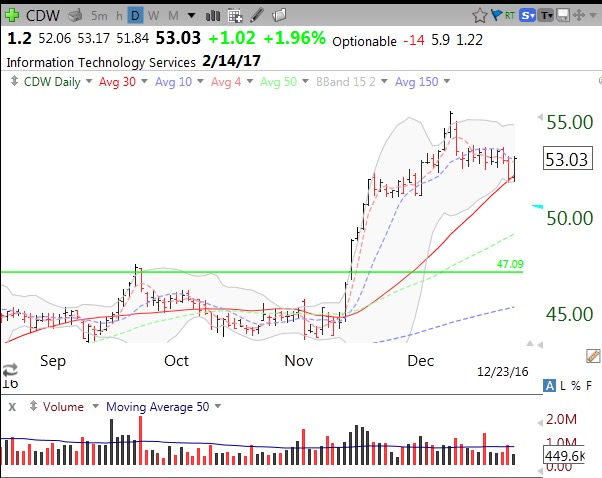
CDW is an example of a stock with an RWBCount=12 that bounced off of support last Friday. I took a position and placed my stop right below Friday’s low. If for any reason CDW declines on Monday so that I am sold out, I will take my small loss–no emotion. (A stock does not have to rise just because I think it should!) On the other hand, if CDW holds Friday’s low, I will ride it as long as its RWBCount remains high (11 or 12). My goal will be to ride the strong up-trend until it ends and not to try to hop off the first time it shows signs of weakness. Why sell a stock in a strong up-trend? If CDW should rise a few percent, I will move my stop up to break-even. Small losses and large gains–that is the way to succeed in this game. The daily chart of CDW is below. Note the recent green line break-out (GLB) to an all-time high and Friday’s bounce up off of the 30 day average (red line) and its lower 15.2 daily Bollinger Band. Earnings are set for release on 2/14/2017.
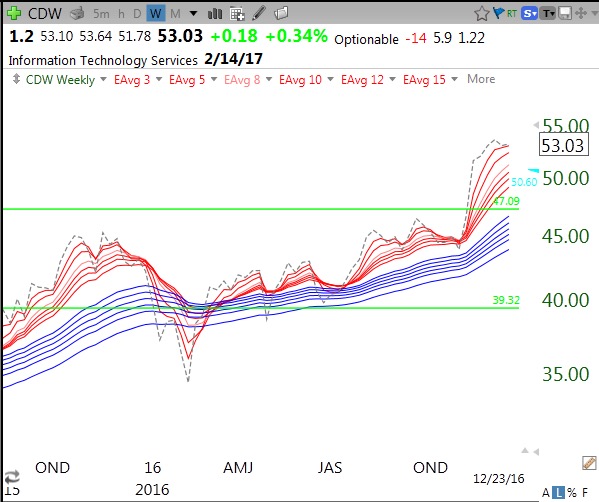
Here is the RWB chart for CDW. In the near future I will publish a scan for finding stocks with IRBCount of 11 or 12 that are bouncing off of support. You can sign up for access to my free TC2000 scans at wishingwealthblog.com/club.
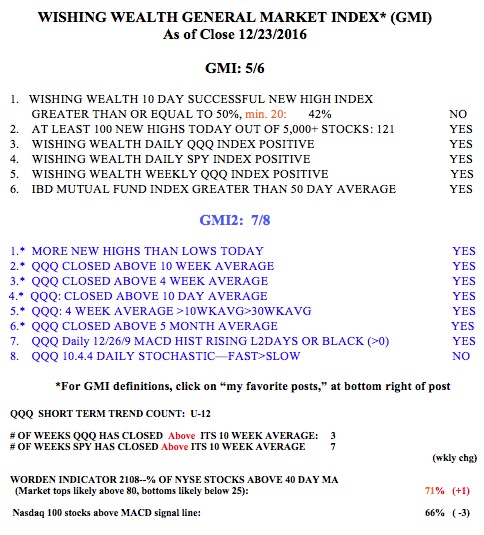
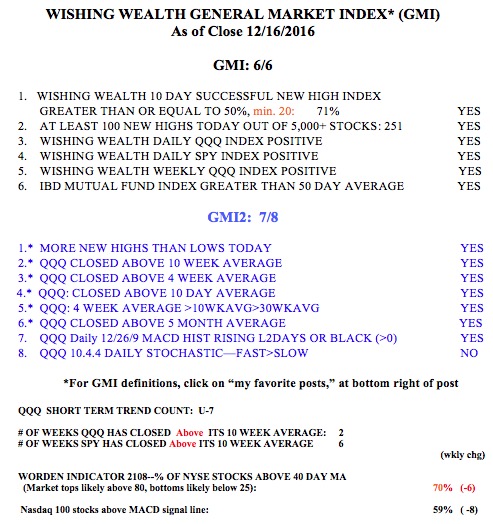
The GMI remains at 5 (of 6).