Blog post: 33rd day of $QQQ short term up-trend; $QQQ remains in a daily RWB up-trend; so does $AAPL

GMI6/6
GMI-27/9
T210838%

RWB up-trend means that all 6 shorter term averages (red) are rising above 6 longer term averages (blue) with a white space between them. The black dotted line is the daily close. The first sign of weakness occurs when the dotted line goes below the red lines, leading them lower. This is a modified GMMA chart, invented by Daryl Guppy.

AAPL shows a similar pattern and a recent GLB to ATH.


Blog post: 32nd day of $QQQ short term up-trend; Key to success in market is to have an objective, defined set-up that implies an immediate move up, then if it fails to move rapidly as predicted exit quickly with a small loss; I teach my students several set-ups that I like; one of them is the black dot signal, defined below

GMI5/6
GMI-27/9
T210846%

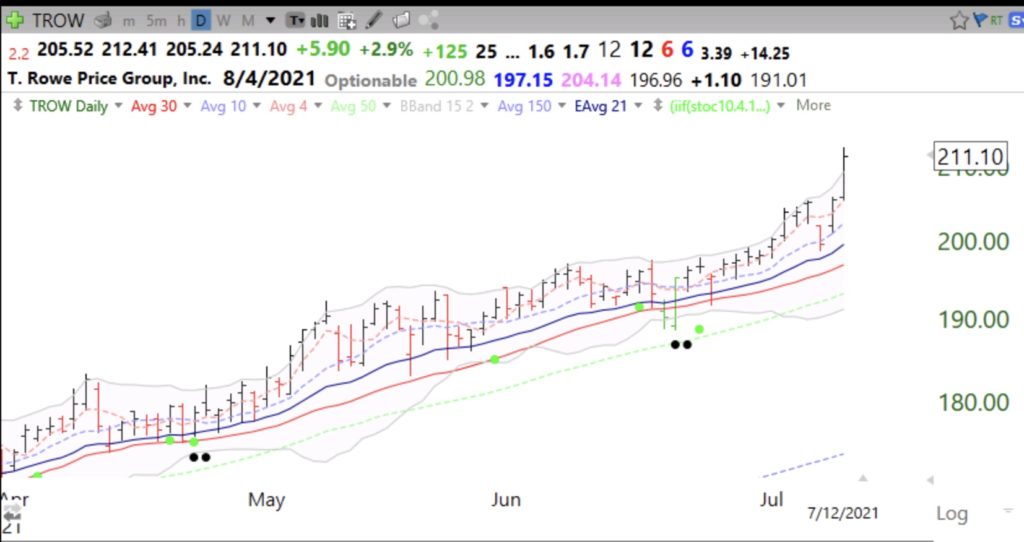
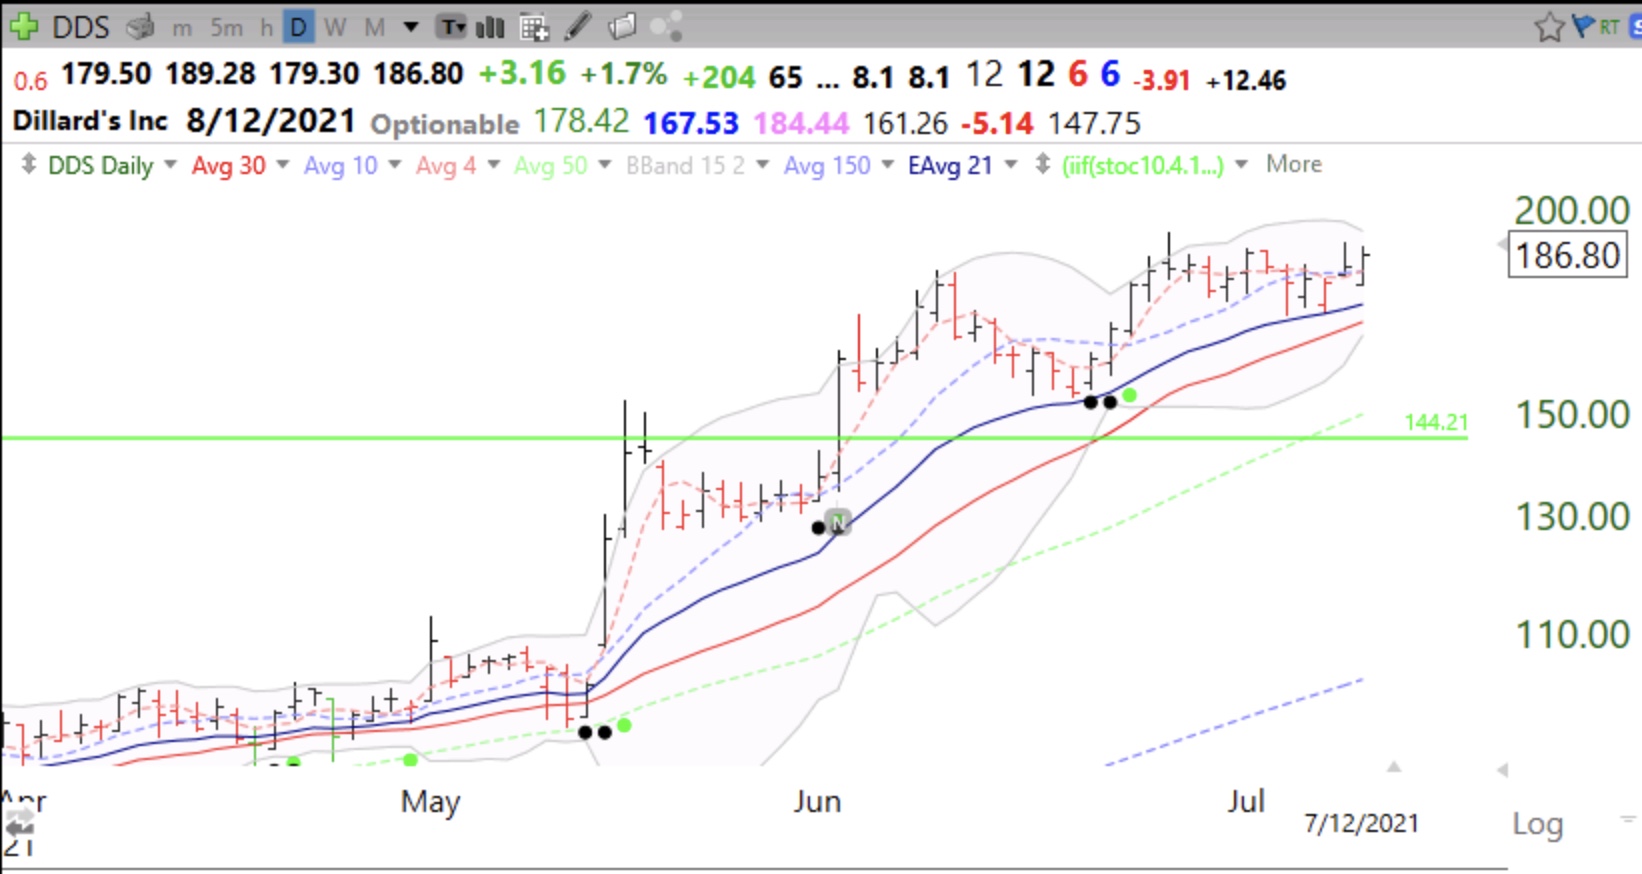
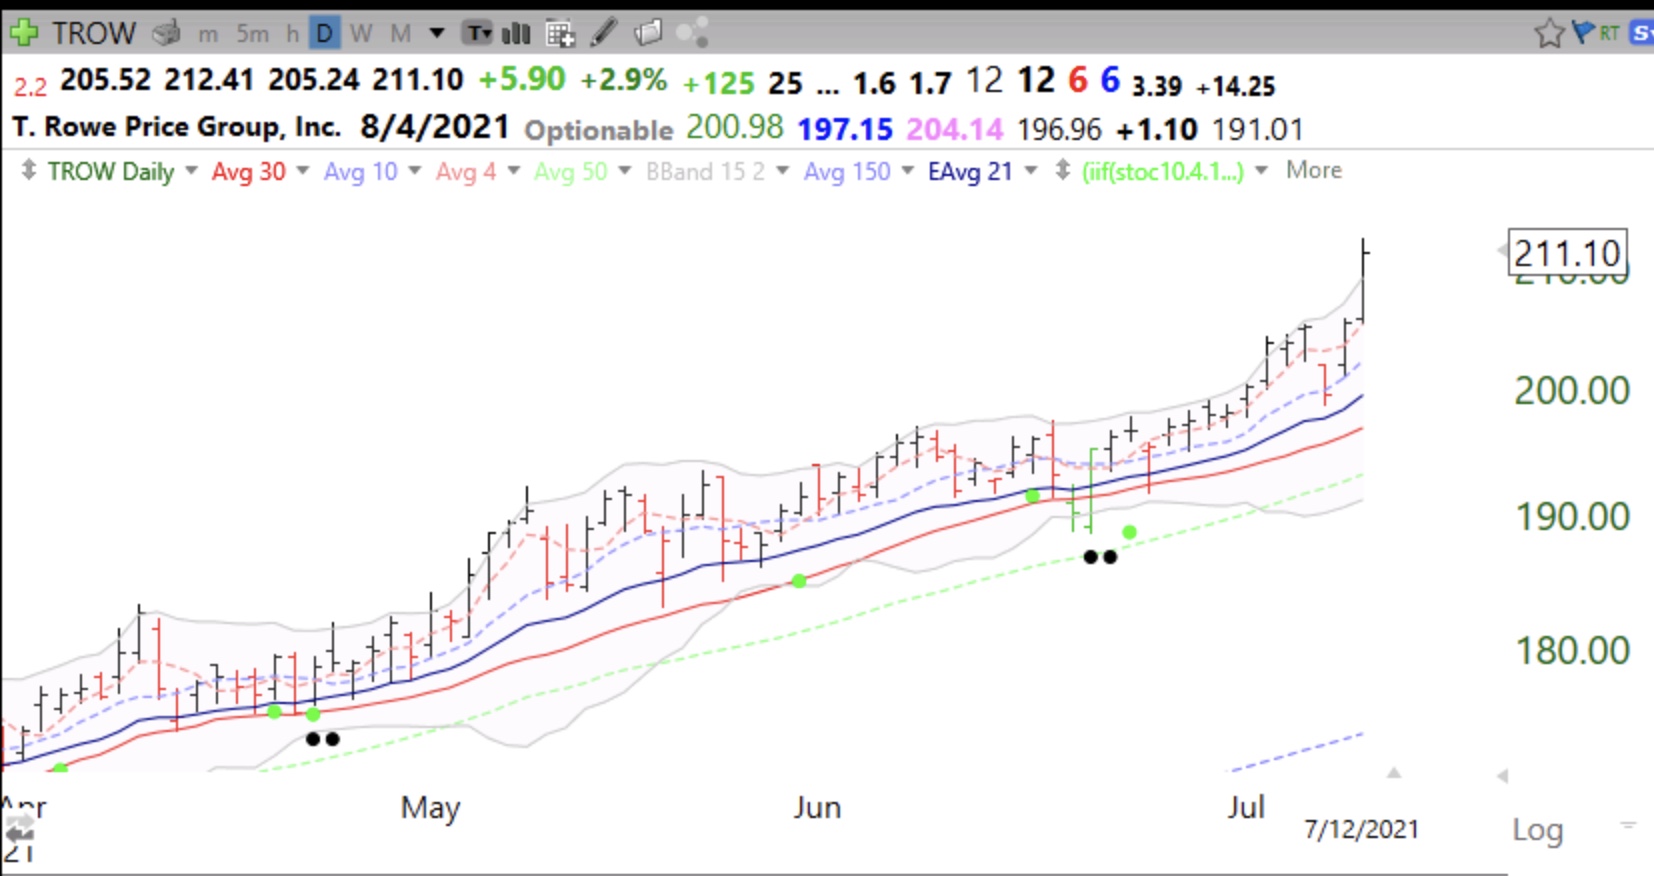
I have TC2000 (see TC2000 tab on blog)  draw a black dot when a stock in an up-trend bounces up from oversold. Oversold is defined as having a daily 10.1 stochastic value of 25 or less in any of the past 3 days. I have discovered that almost every significant rise in a stock begins from an oversold level. But not every oversold level leads to a big rise. Check it out for yourself. The key for me is to find a launched rocket near an all-time-high (ATH) that has become oversold and begins to move up. I can then buy it and place my stop loss below the low of the bounce. My recent TraderLion and Long Island Stock Traders Meetup presentation slides (see prior recent posts for the workshop  links) show how to put a green dot indicator on a daily stock chart. Here is a copy of the slide with the link.


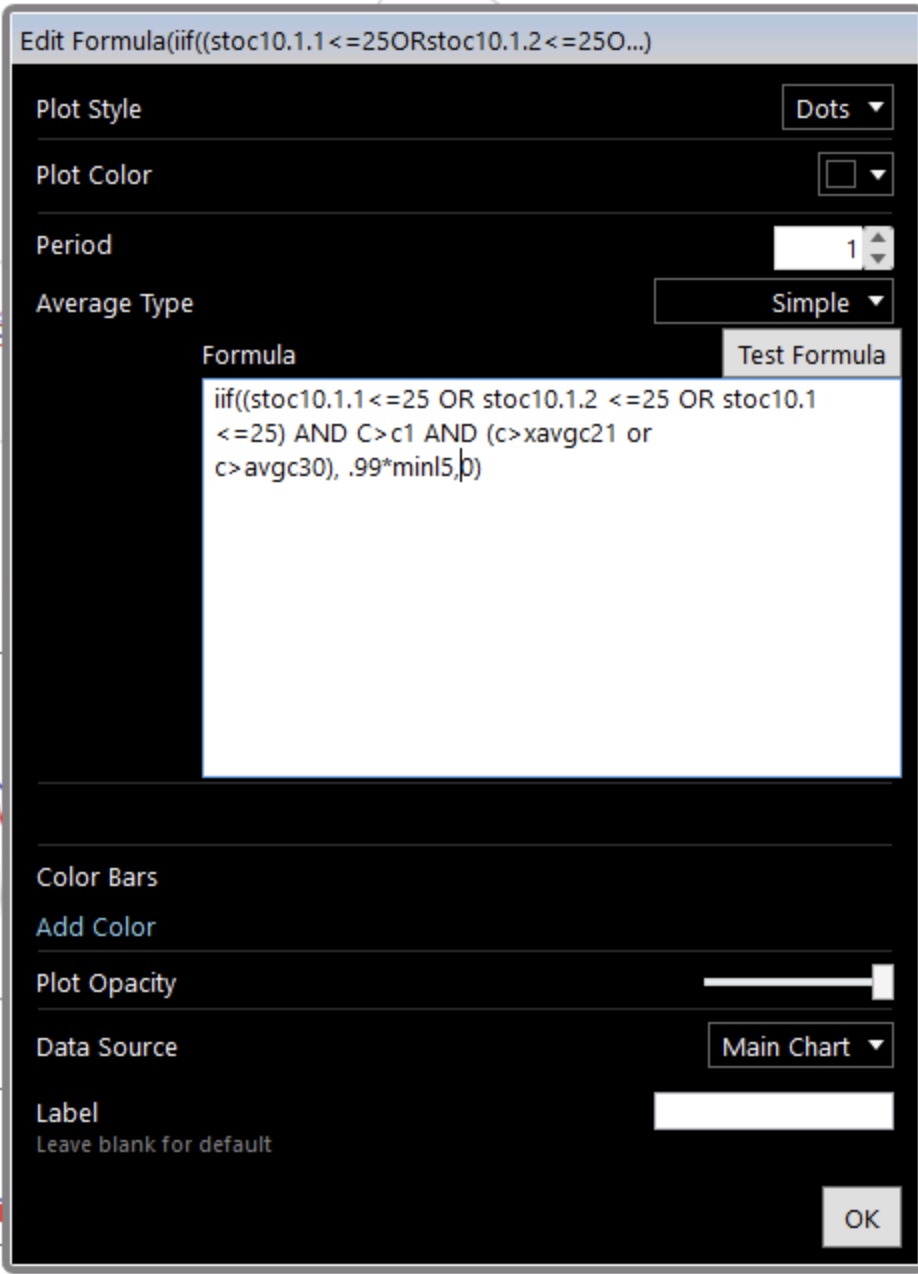
To create the black dot signal instead replace the formula in the tutorial with the logic:

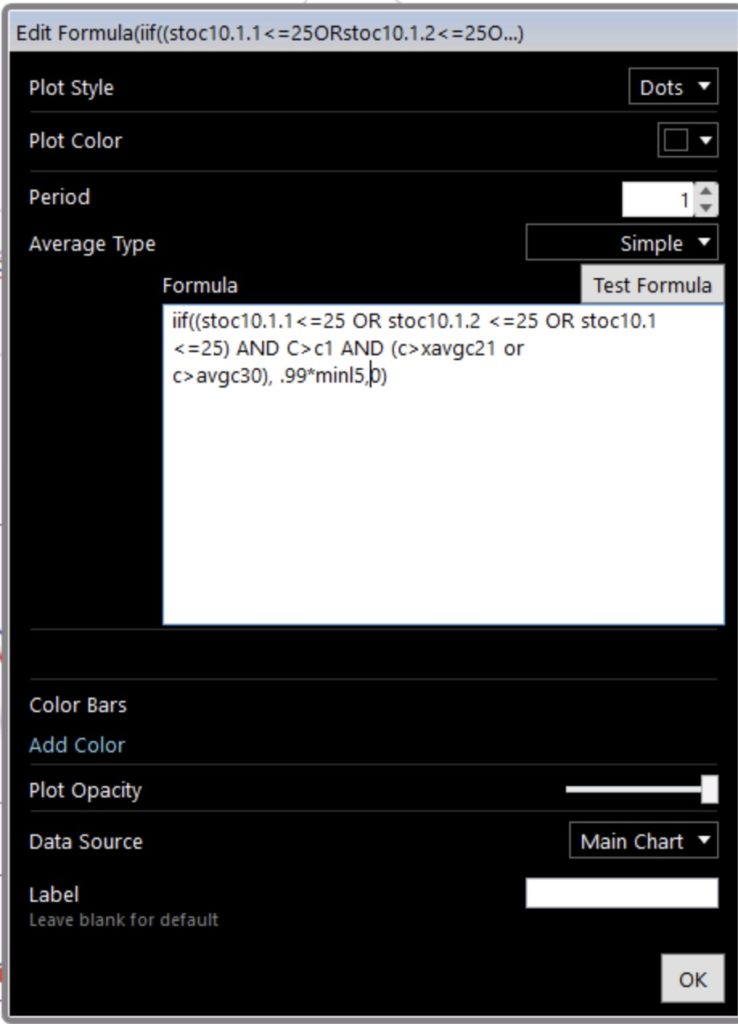
I want the 10.1 daily stochastic in any of the last three days to be le25 and for the stock to be higher today than yesterday and to be above its 30 day simple average or its 21 day exponential moving average. The dot is placed at the 5 day low price.

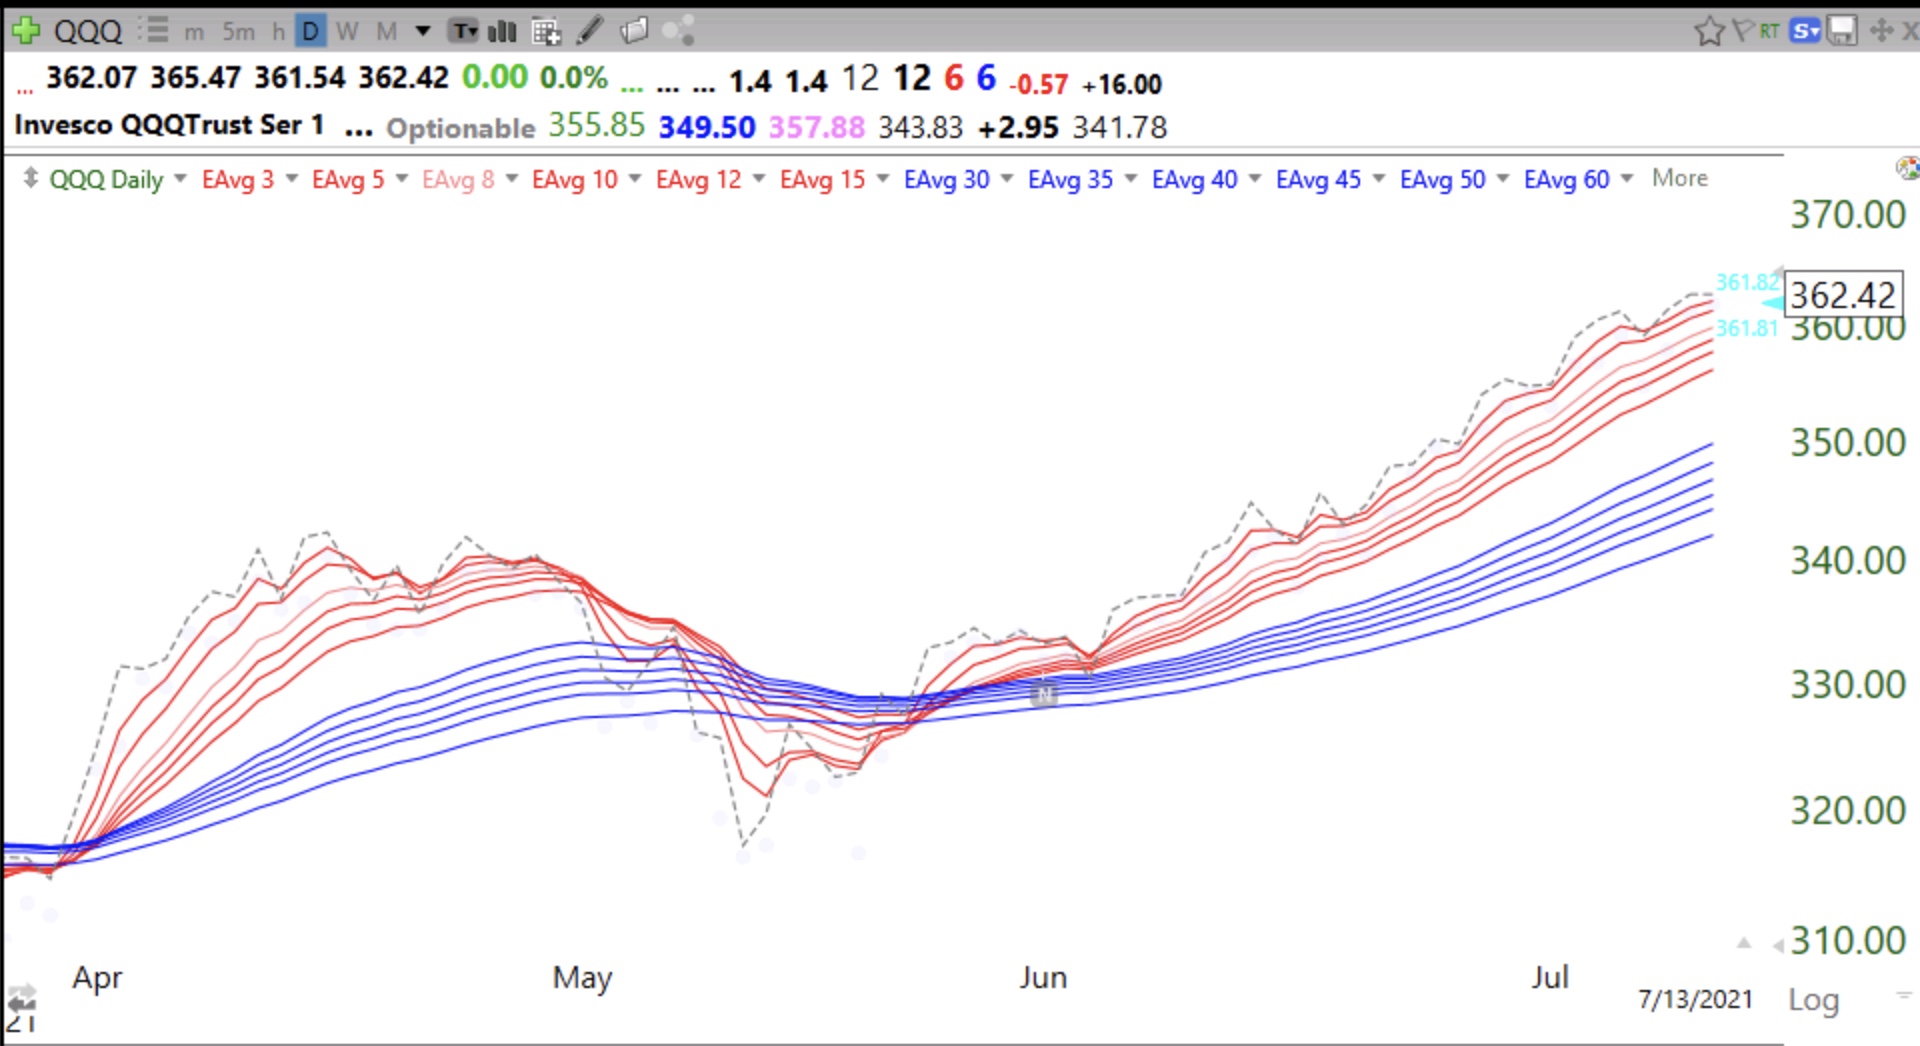
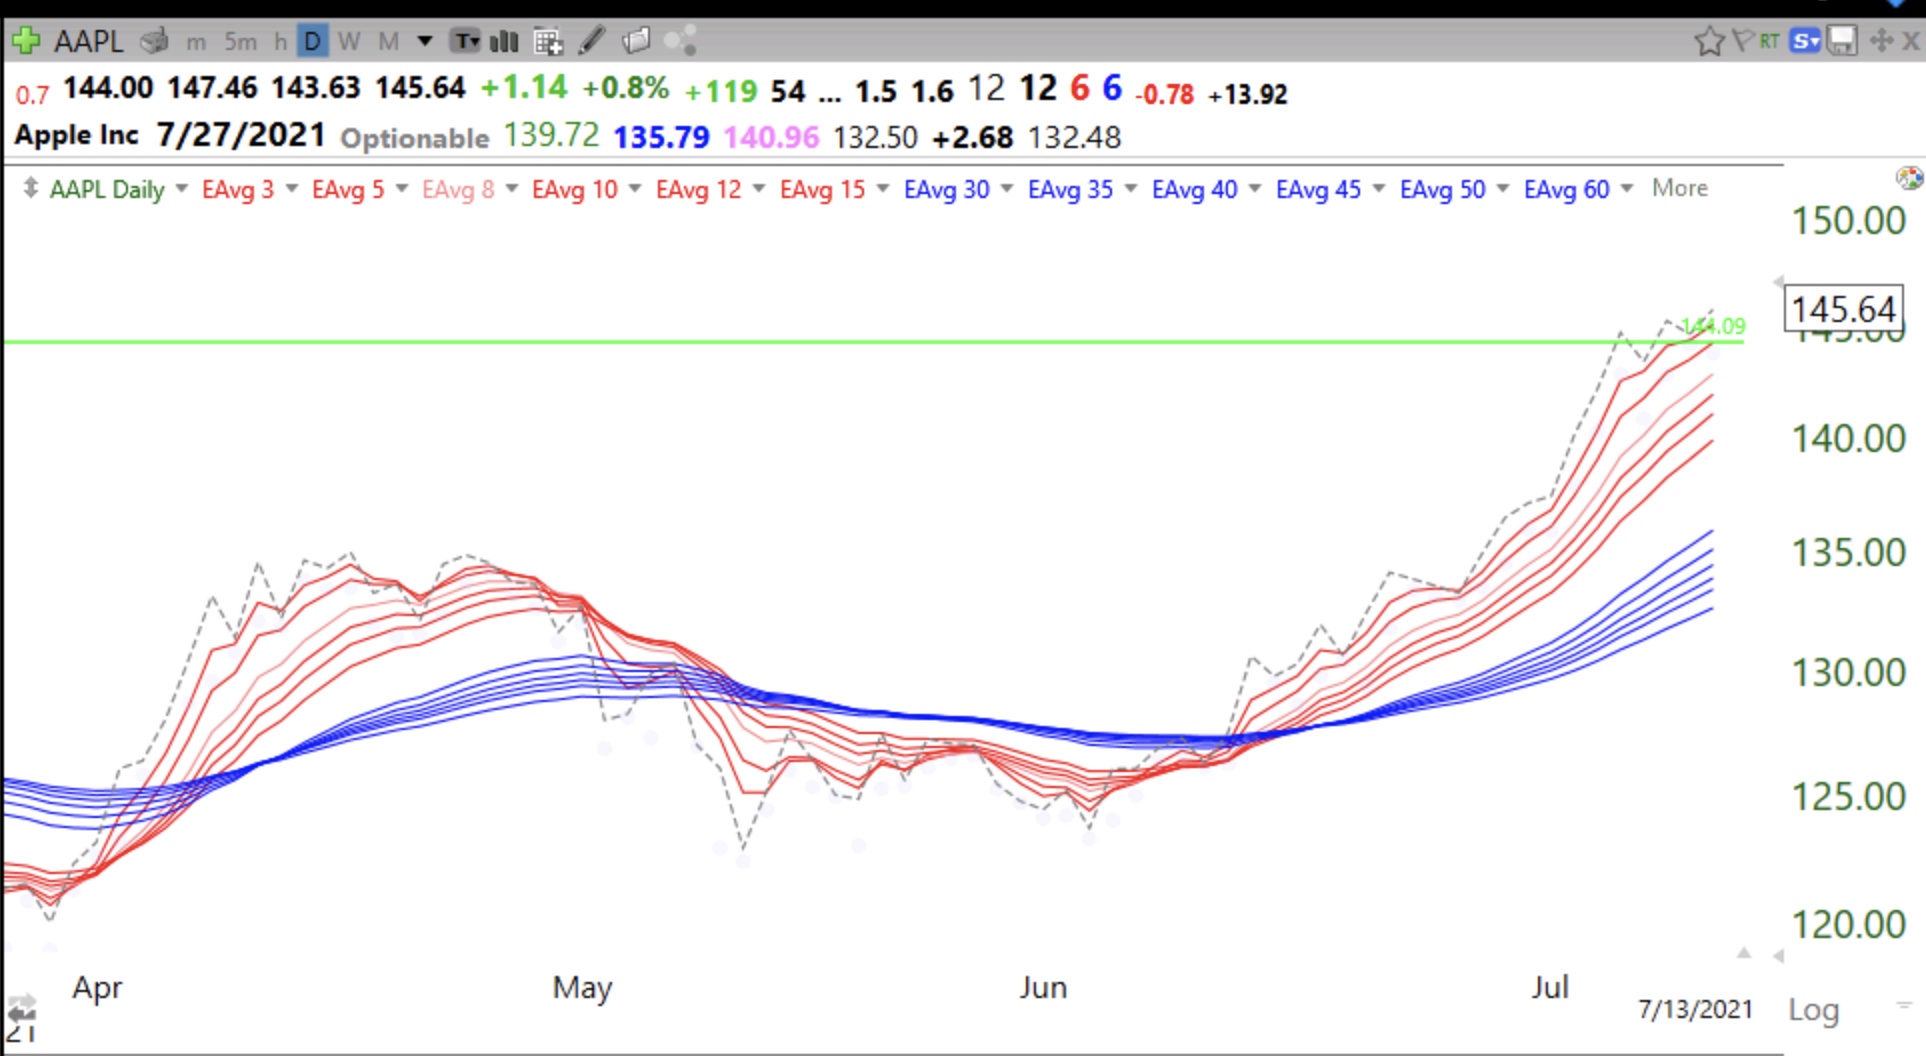
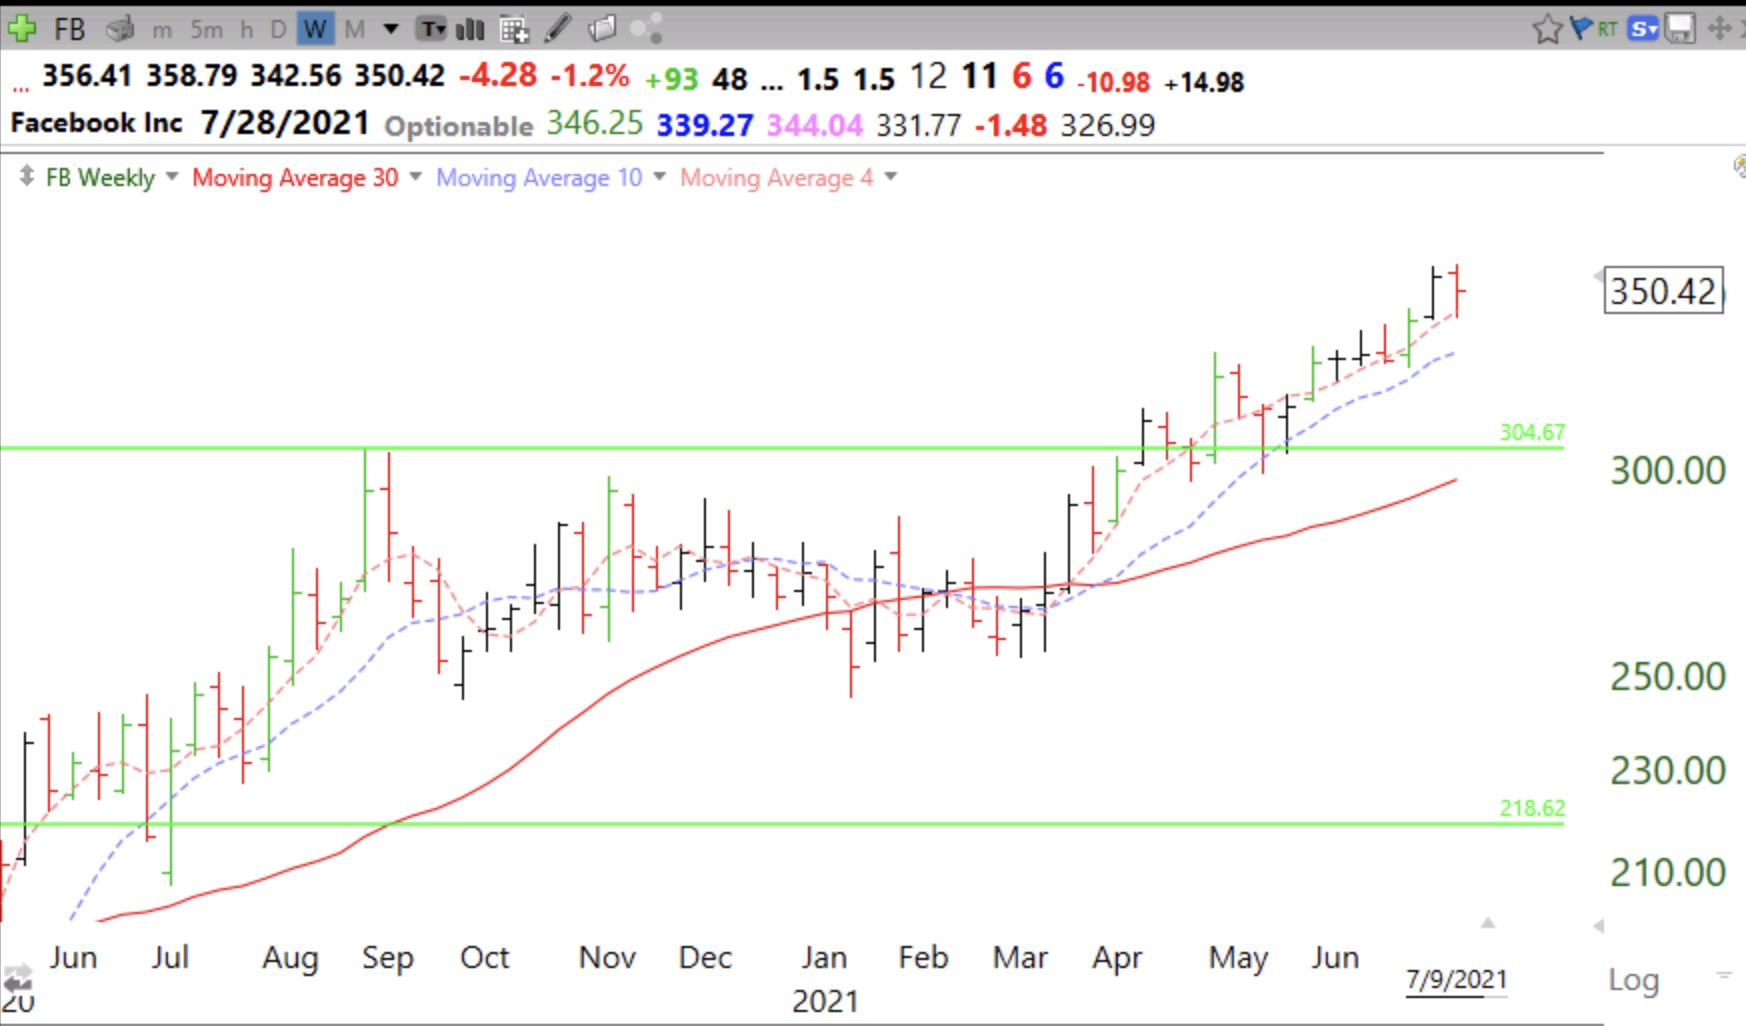
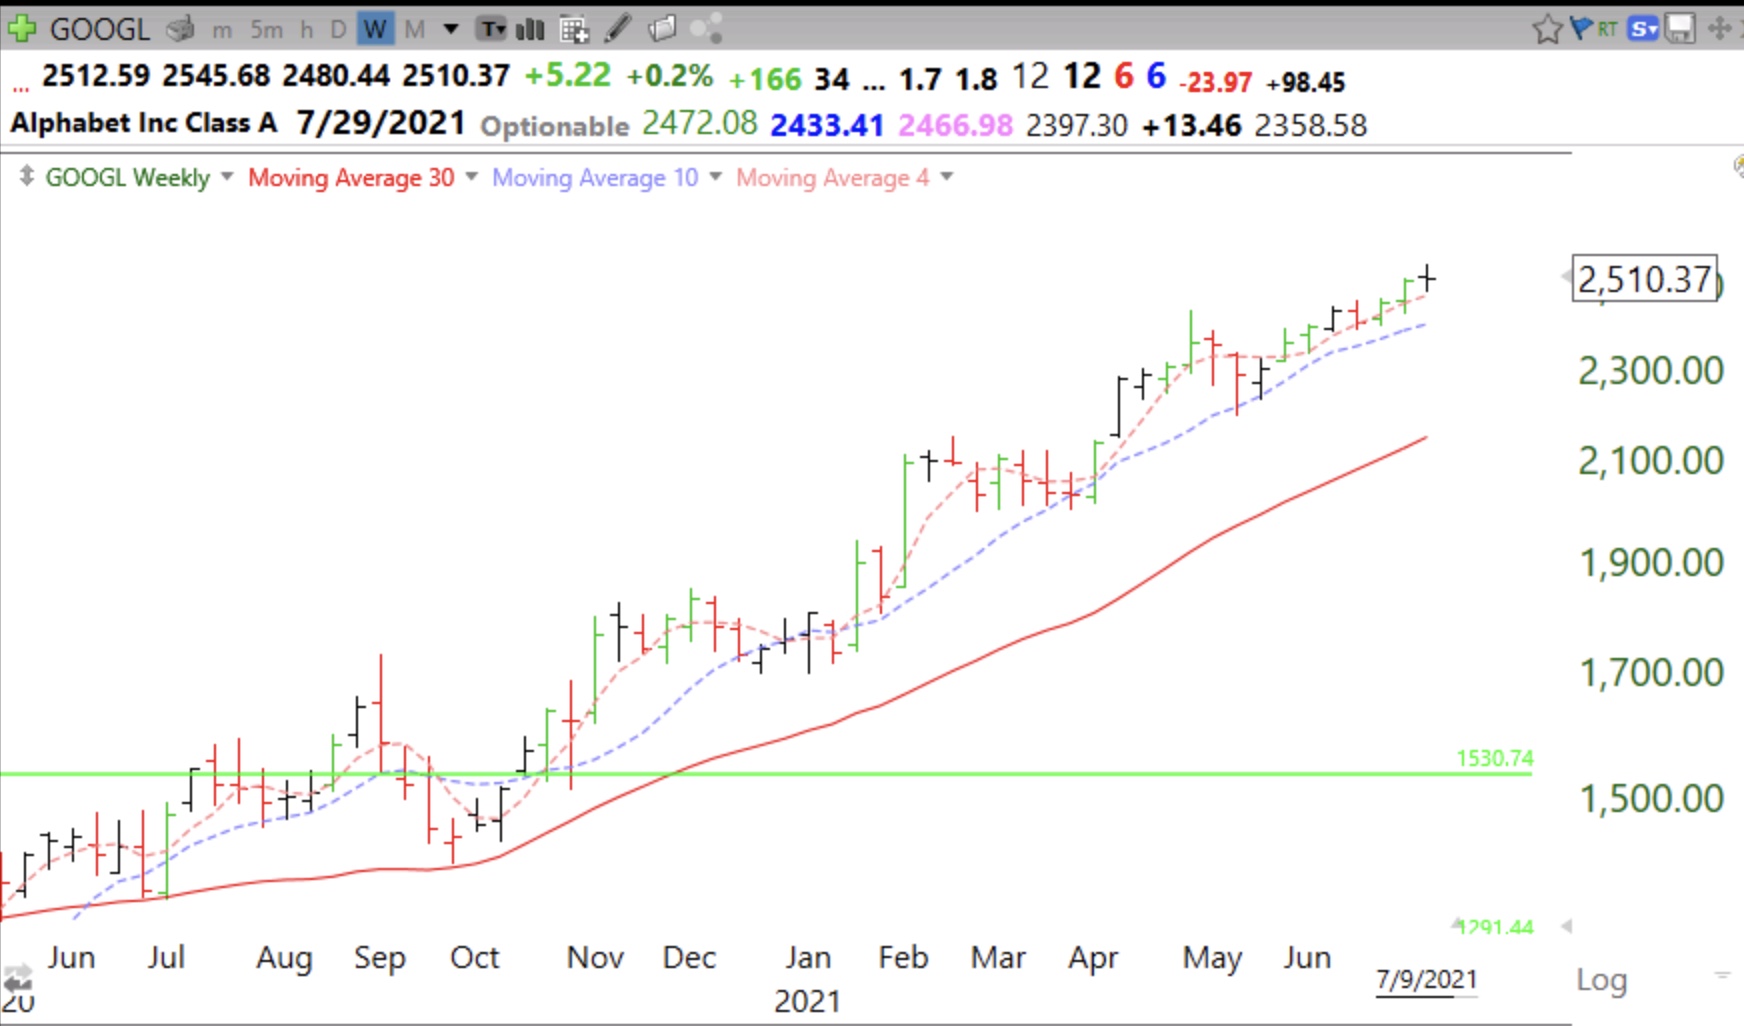
Here are 2 examples of stocks with black and green dot signals. See if you can replicate them and then add the 10.1 stochastic indicator below the price. I love a black dot signal soon after a green line break-out (GLB). I have a TC2000 scan to identify such stocks.


Blog post: $AAPL and $AMZN and $FB have GLBs, augurs well for $QQQ up-trend, now in 31st day; look at $GOOGL post GLB; GMI remains Green at 6 (of 6)

GMI6/6
GMI-27/9
T210844%

These weekly charts show that several of the FAANG stocks have recently had GLBs to all-time highs. Since these stocks are heavily weighted in the Nasdaq 100 index (QQQ) it is likely that this ETF will continue to advance. However, if these stocks should close back below their green lines it would signal major weakness.

Look what happened after GOOGL had its GLB last October.