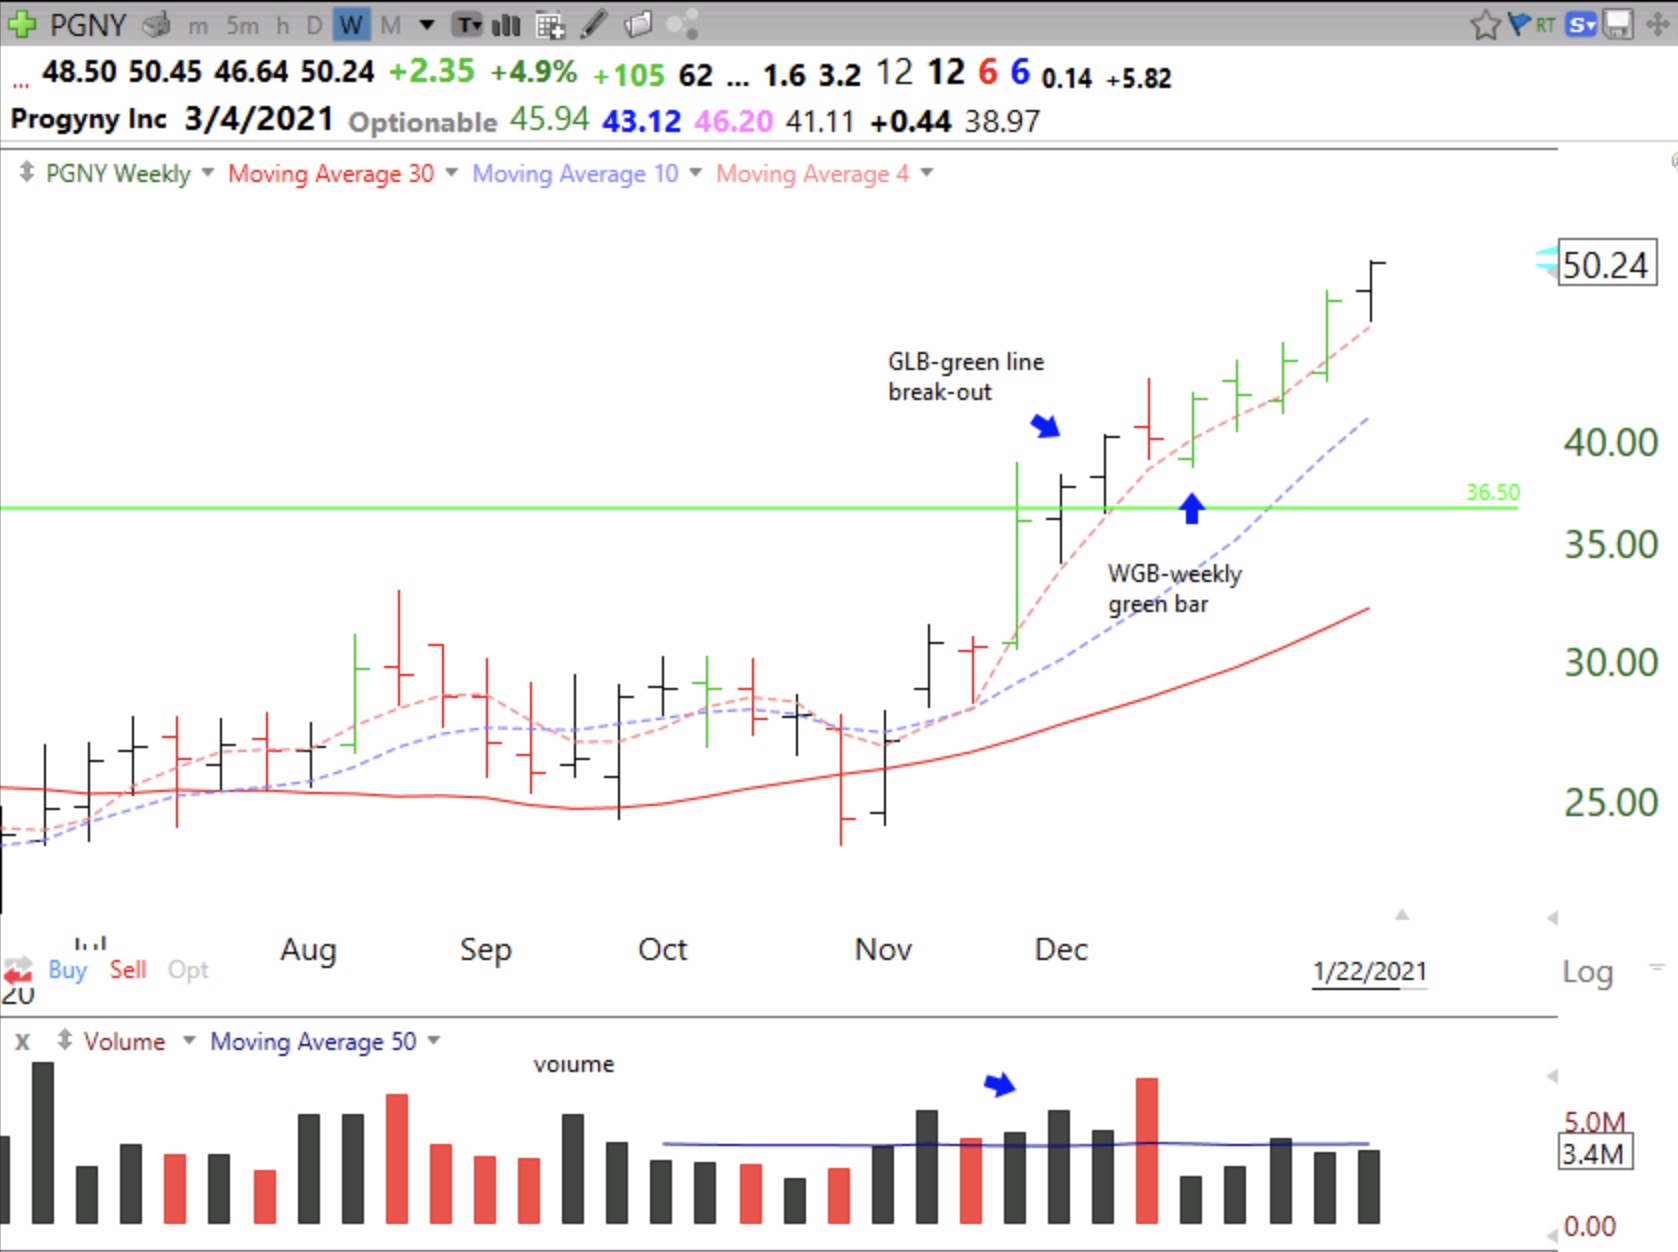
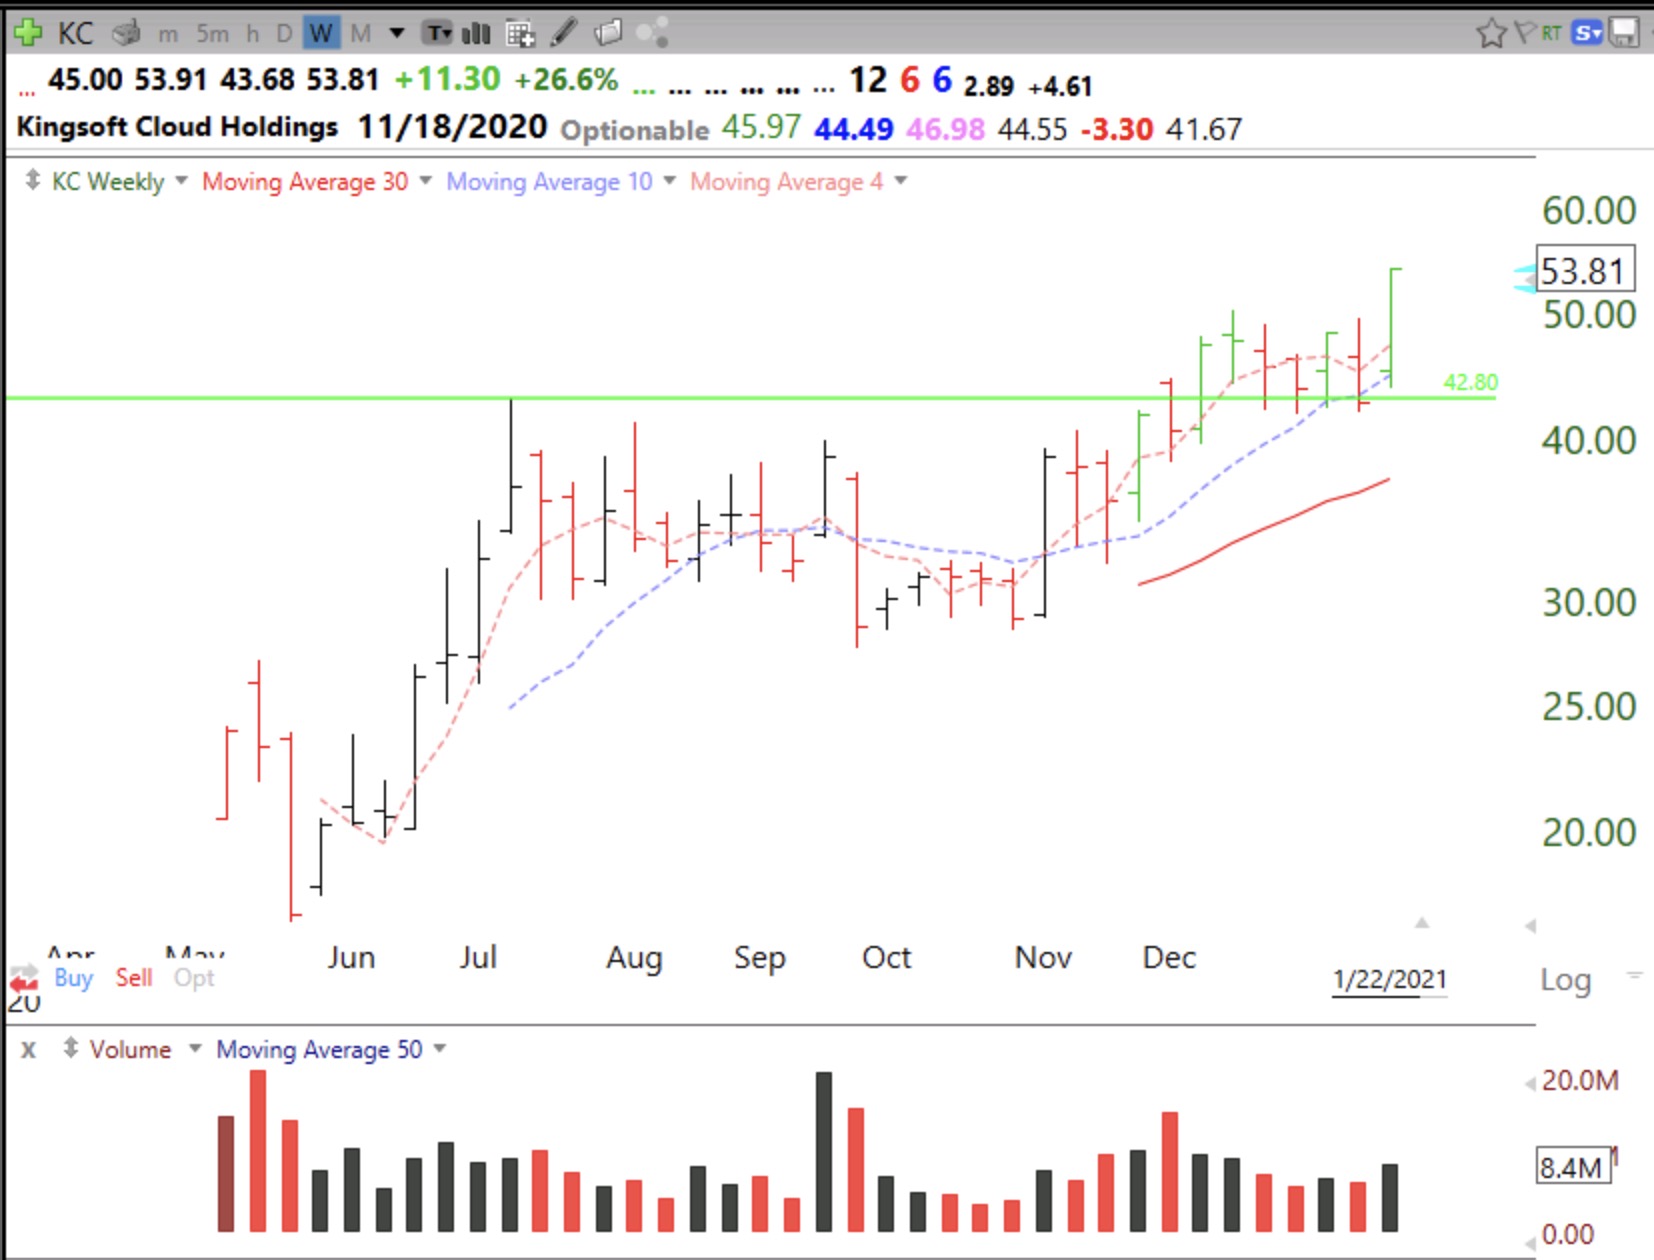
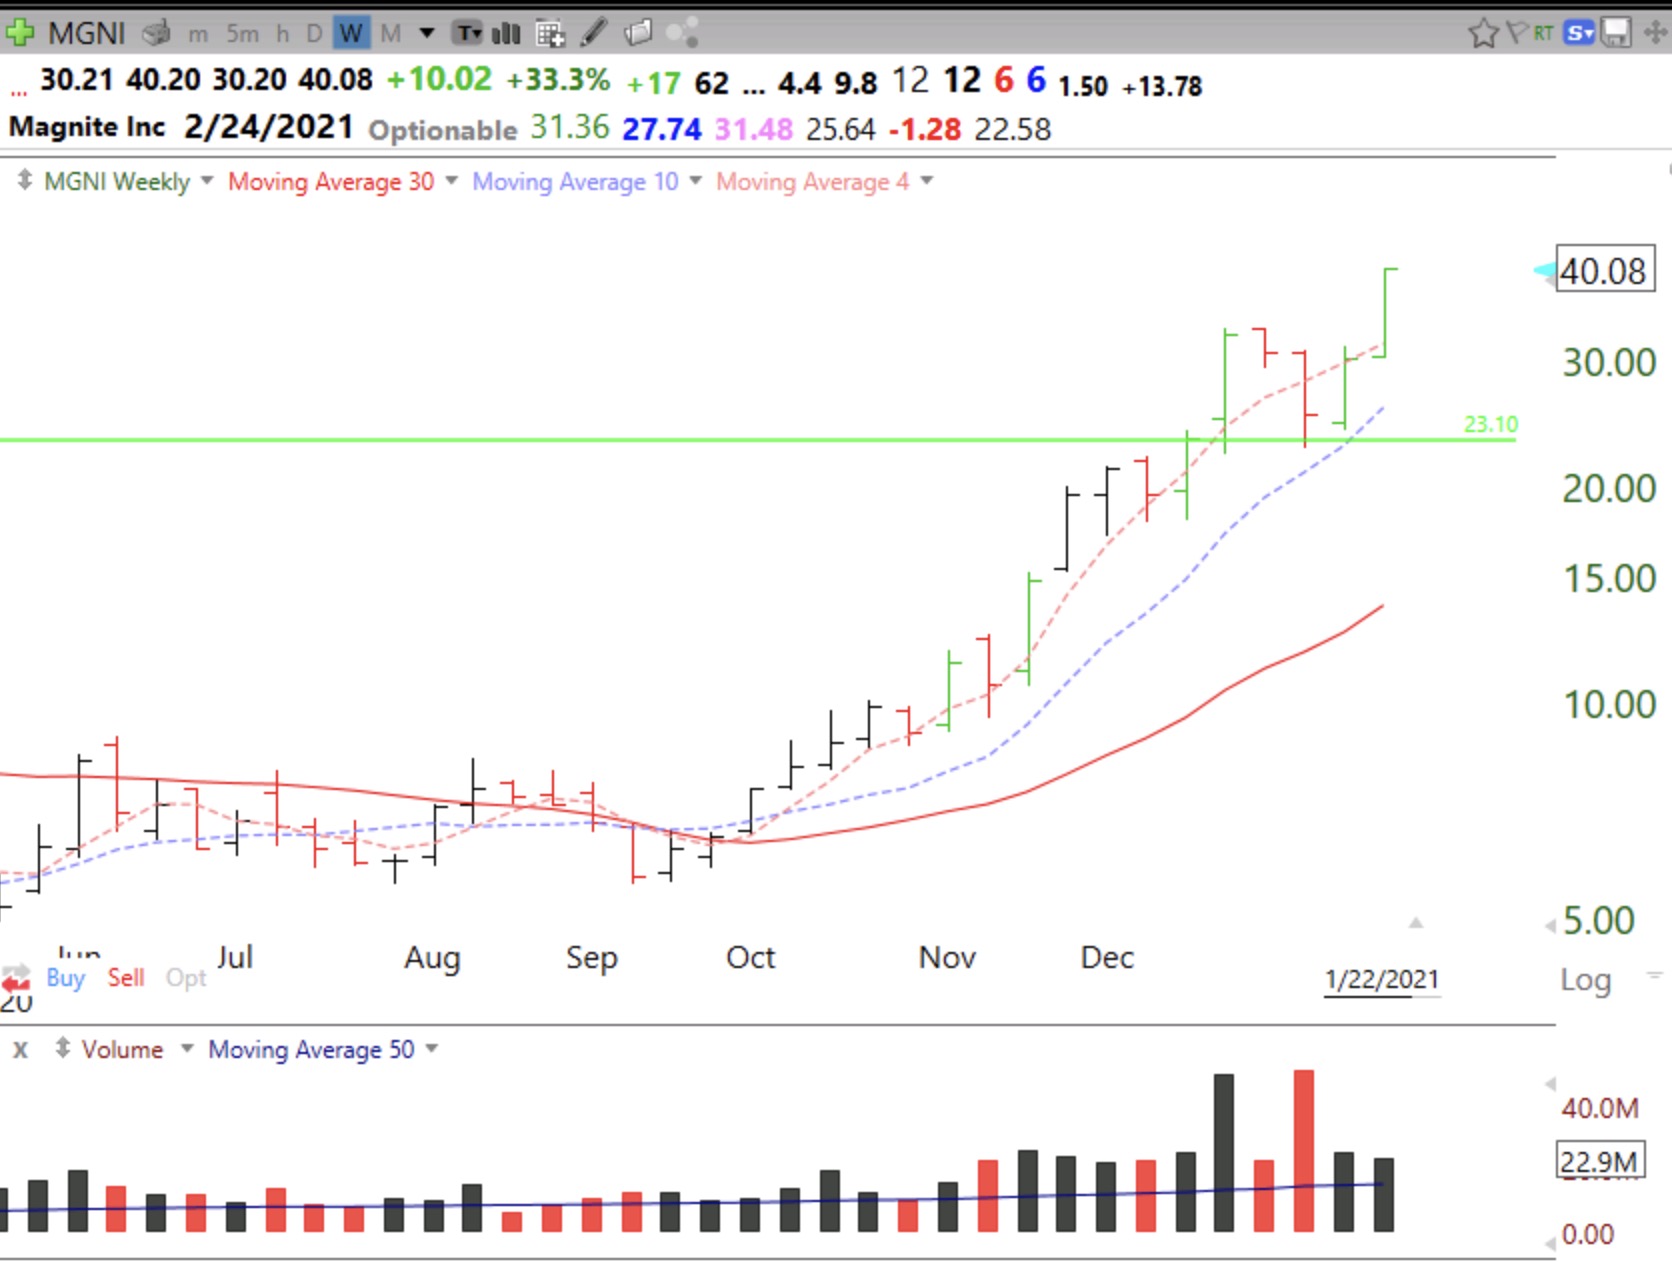
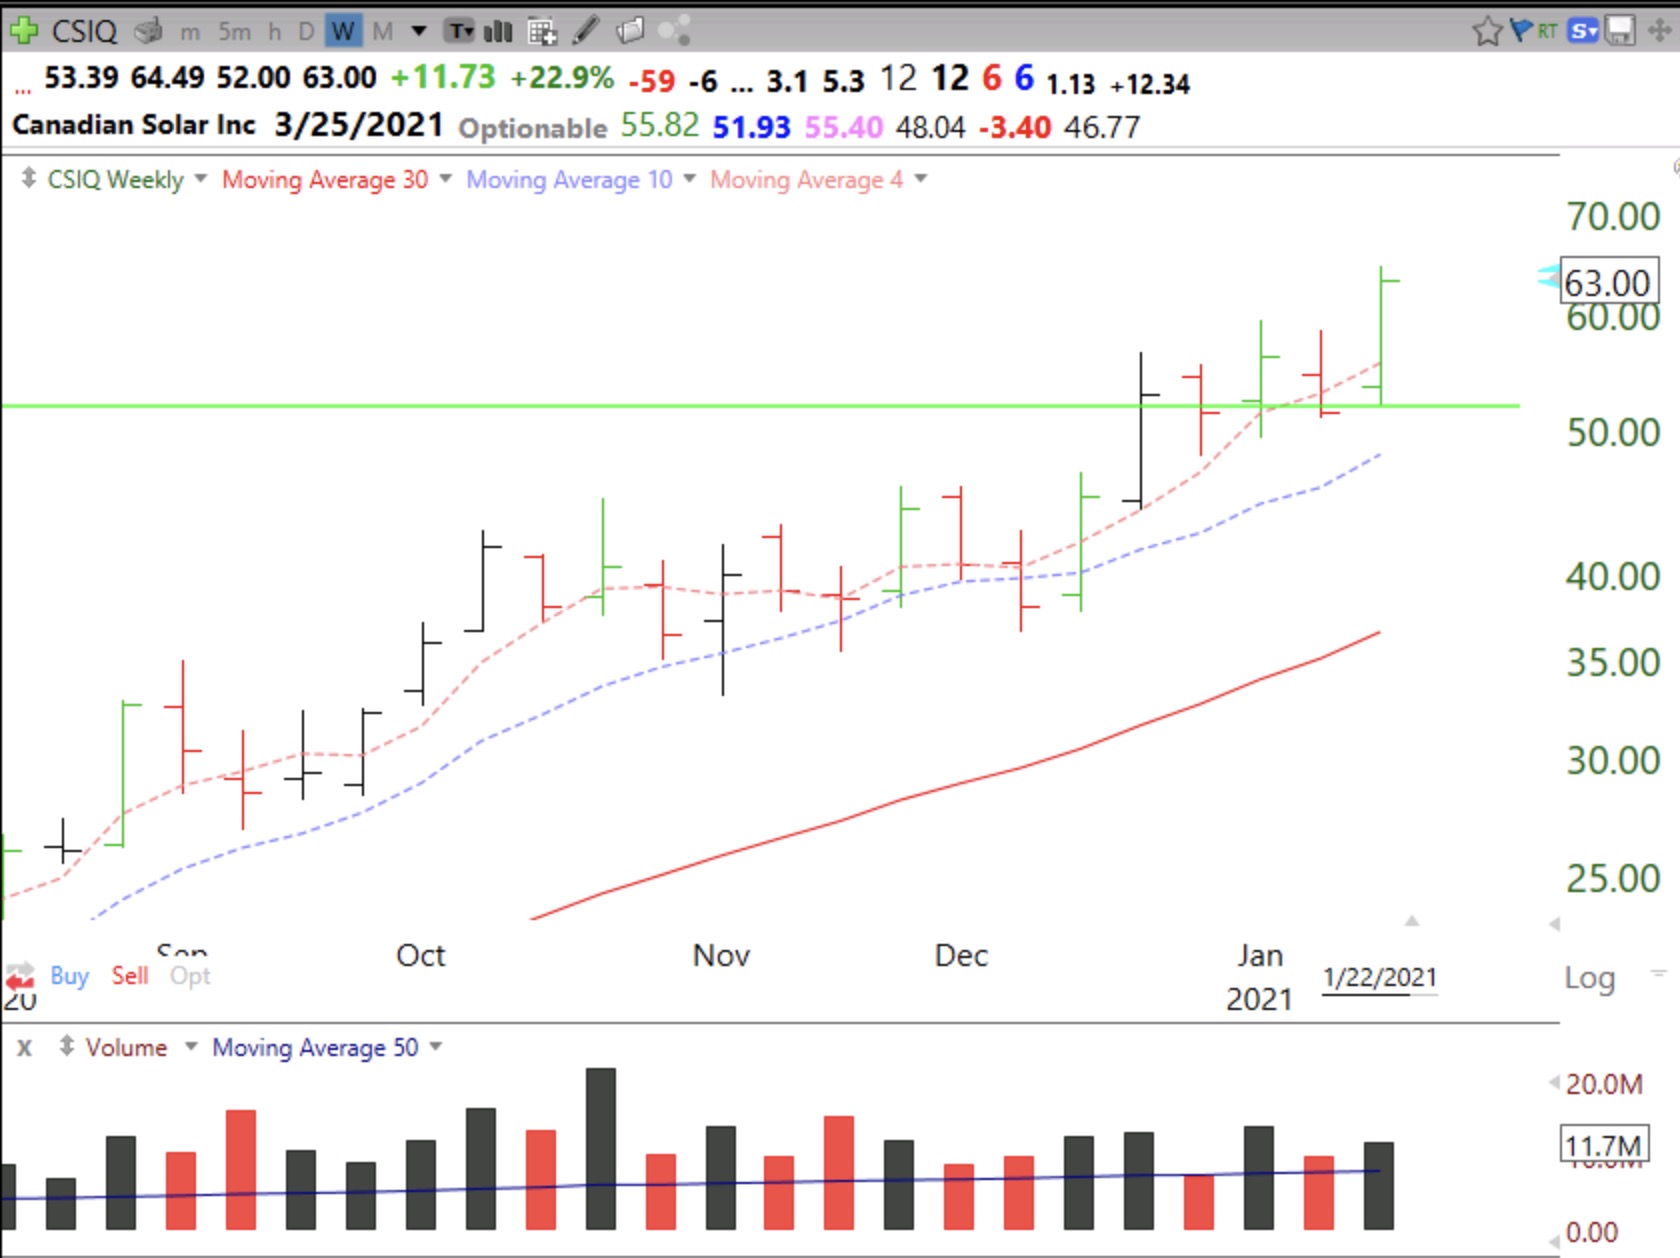
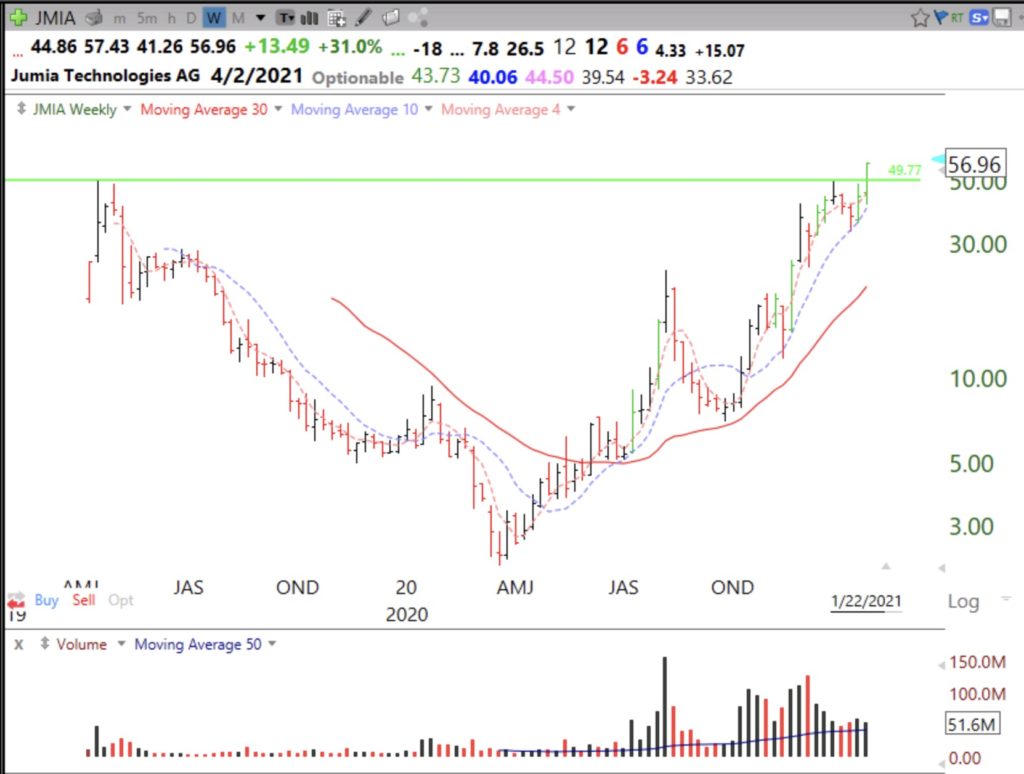
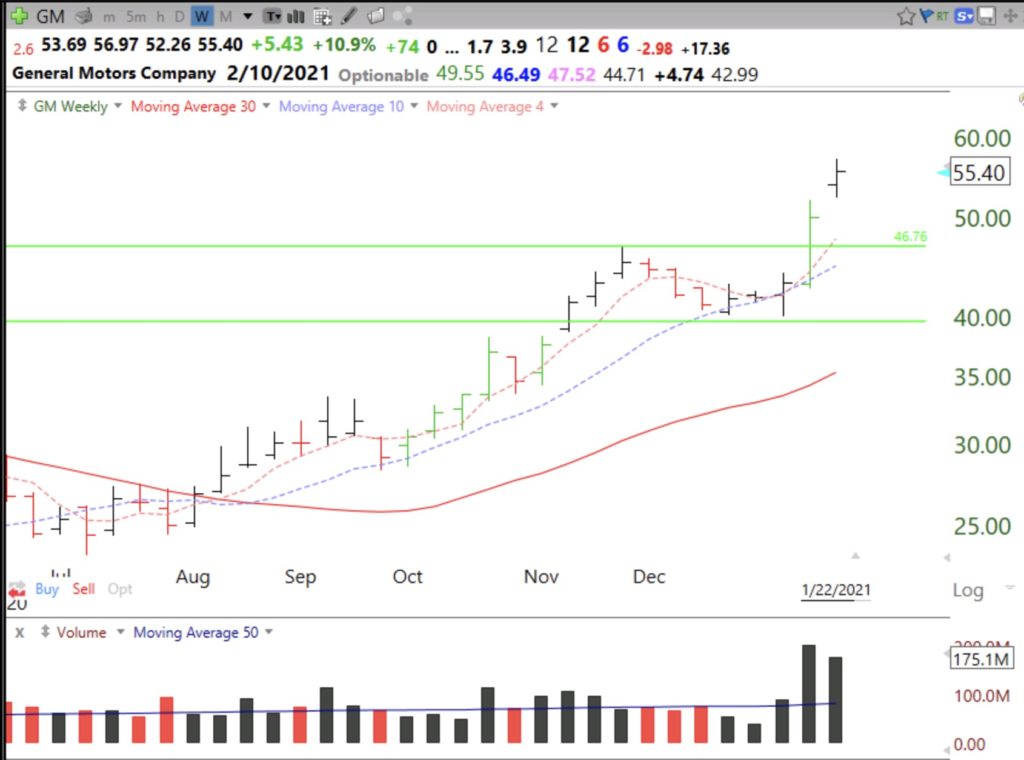
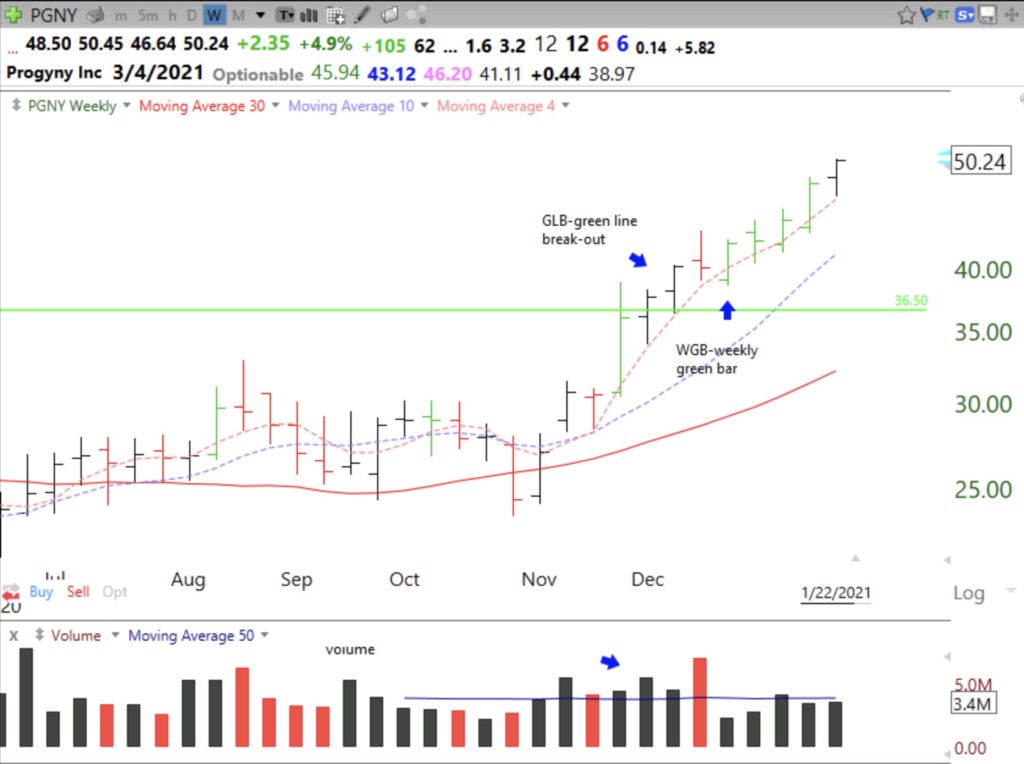
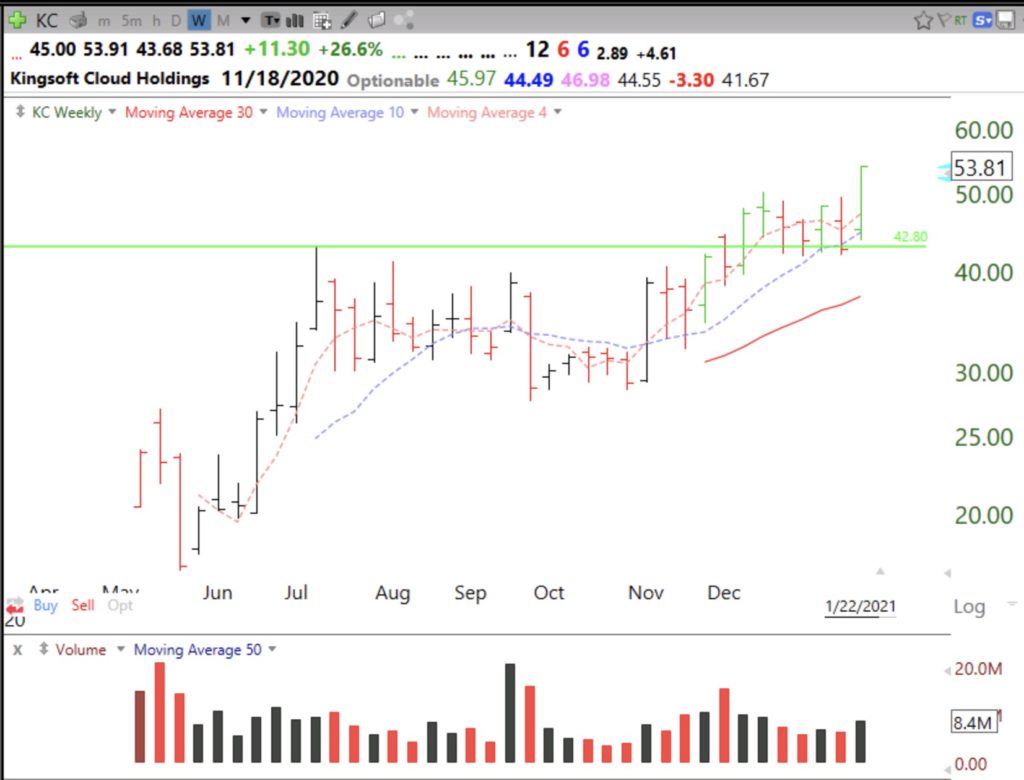
I decided to draw a green line on a monthly chart at the highest price bar reached, the all time high (ATH), that was not exceeded for at least 3 subsequent price bars (i.e. 3 months). Conceptually, the green line indicates an equity that has traded at an ATH and then went sideways or down below the ATH for a minimum of 3 months. In other words, the stock formed a peak and then entered a period of consolidation. A green line break-out (GLB) occurs the first time the equity finally closes above the green line. The GLB is most significant if it occurs on above average daily trading volume.
Why should a GLB be a bullish sign? People who bought the stock near the peak price and watched it go down or nowhere for months often only want to get their money back by selling if the stock rises back to near where they purchased it. This constitutes over head supply or selling pressure all the way back up to the green line. If a stock can overcome this overhead supply and break out to an ATH it is showing considerable buying interest and technical strength. That is why GLBs often prove promising.
GLBs are even more significant if they occur in a recent IPO. The great trader, Jesse Livermore, spoke about the terrific set-up of buying a recent IPO that consolidated and then broke out to an ATH. And Nicolas Darvas wrote that he liked to buy stocks that had already doubled in the past year and that were trading at an ATH. For a very recent IPO, I might draw the green line after only 1-2 months of consolidation. A GLB on an IPO is often bullish because most people are not aware of this new security or many figured they missed it as it consolidated after coming public. As the stock climbs to new highs there will be many new buyers who notice and want to accumulate it.
There are several ways I find GLBs. All involve using the TC2000 software program for analyzing stocks which I have used for over 20 years. All of my students receive academic accounts so they may learn to use TC2000. (You can receive a discount coupon for trying it at the top of this site.) I can scan for stocks hitting a 52 week high with this formula (H=maxh52 on a weekly setting or h=maxh250 on a daily setting) and then review their monthly charts. Many of these stocks may be at a yearly high but remain below their ATH. I do look back 20 or more years because I want only ATHs. I then draw in their green line at the top of the peak monthly bar that has not been surpassed for at least 3 months and then with a simple right click of the mouse on the green line, set an alert to tell me anytime in the next year that the stock trades above the green line. TC2000 sends out alerts on screen, text and email. I can also see if any stocks hitting a new high have just crossed their green line top. Once I draw in the green line it appears on all charts I pull up for the stock.
After I buy a GLB, I must follow it to make sure it closes above the green line. Stocks often retest the break-out and will trade flat above the green line, or even below it. I do not set a stop loss for a GLB to avoid being sold out when a stock trades intraday below the green line only to close the day above it. If near the end of the day it appears that the stock will close below the green line I immediately sell and take a relatively small loss. When any buy set-up fails, I must exit. Most great traders who speak the truth say they are wrong 50% or more of the time but succeed because they sell their losses quickly while they are small and let their gains grow larger. After a loss, I console myself with the thought that every loss brings me to the next gain.
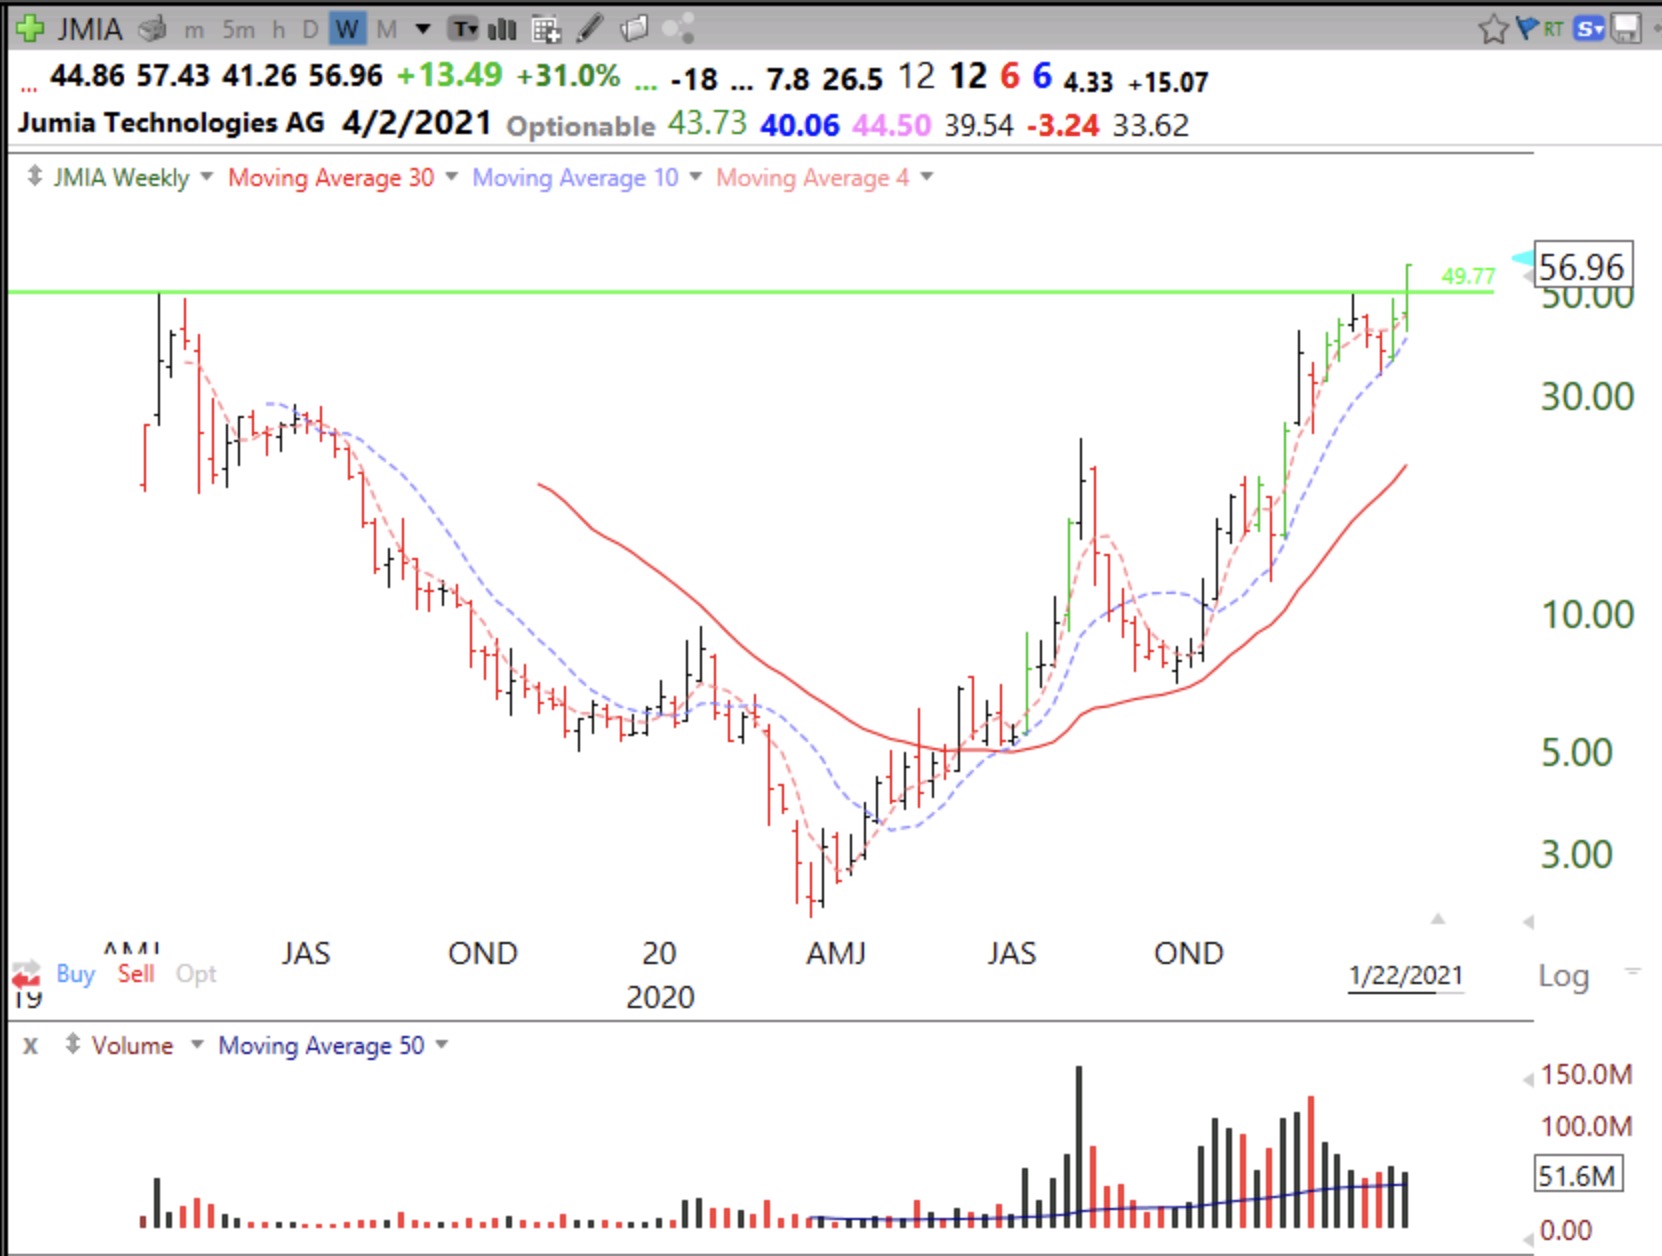
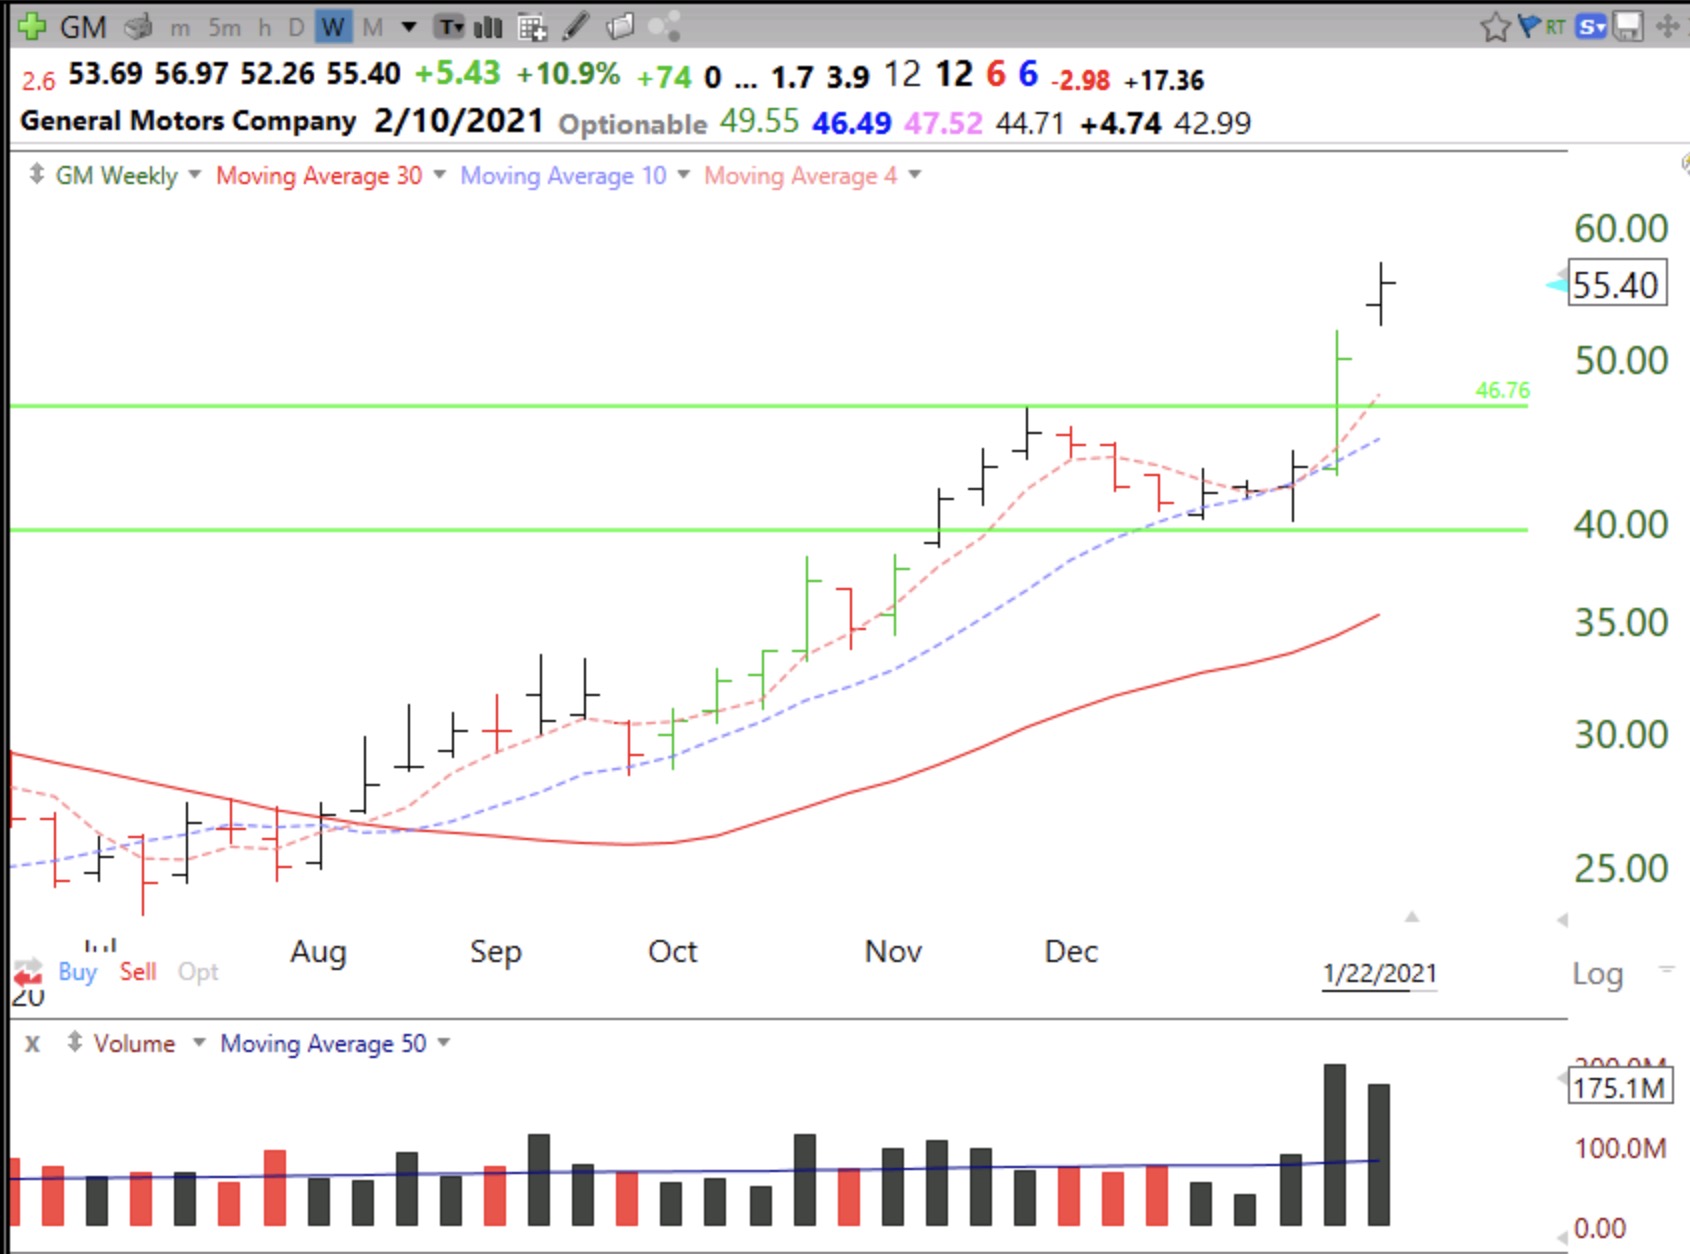
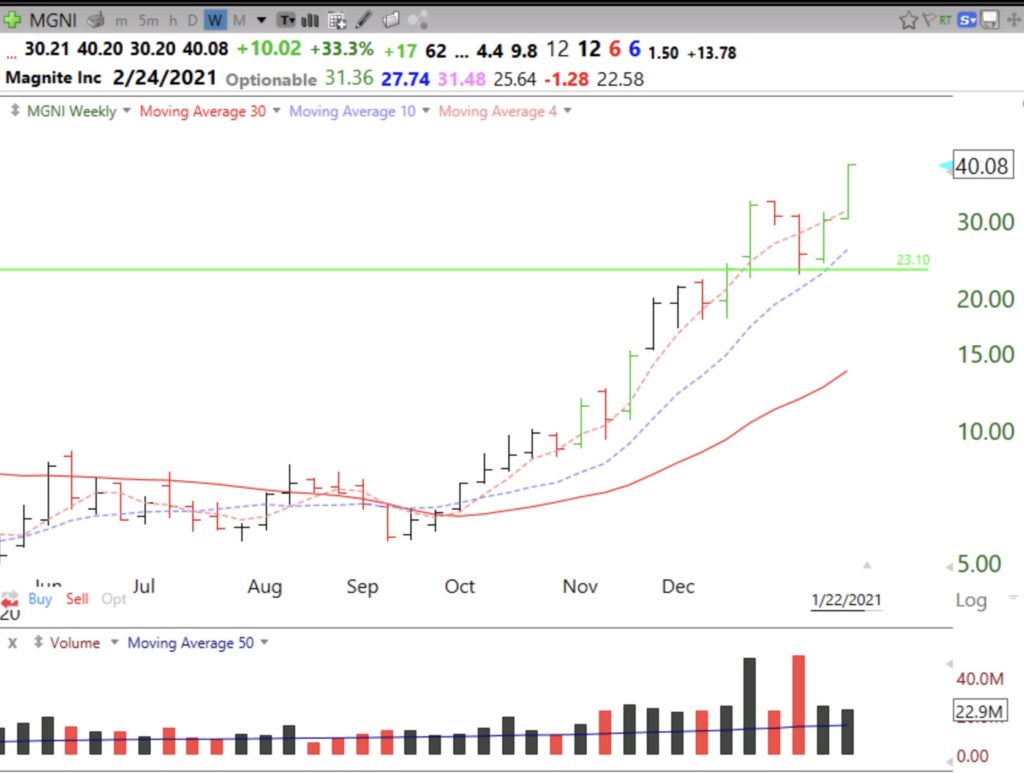
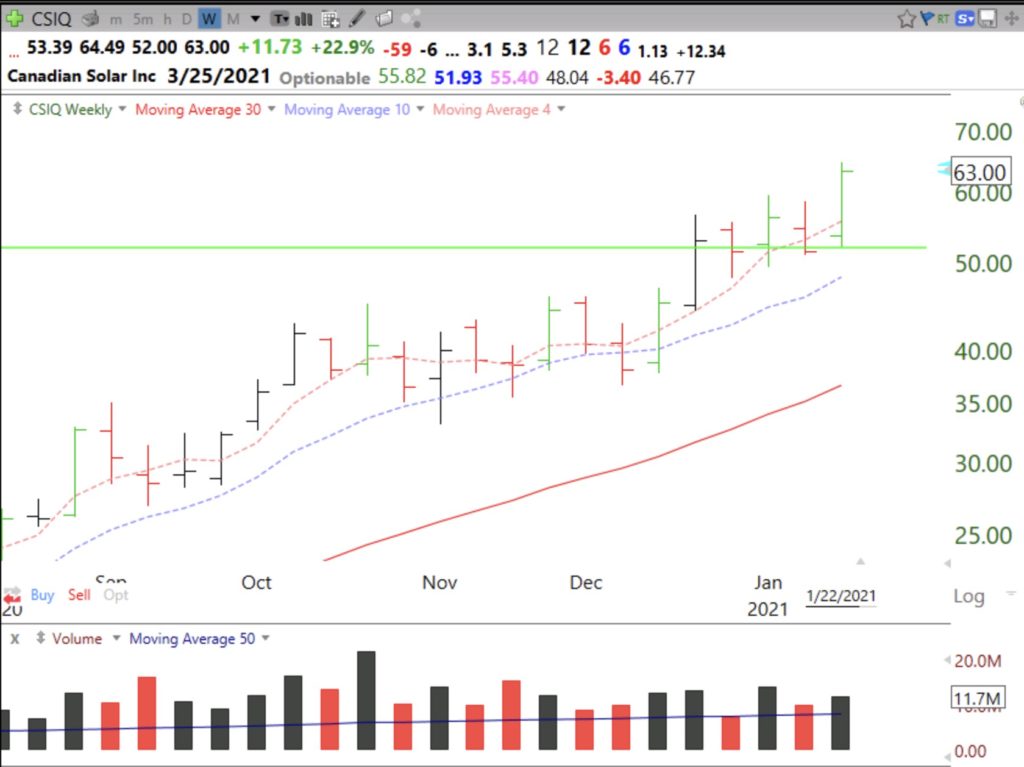
I sometimes tweet out a new GLB intraday (@WishingWealth) but it is important to remember that it is impossible to know in advance which ones will work out. I also may check the company’s fundamentals on investors.com or MarketSmith before buying. In a strong market up-trend like the present, GLBs often work out. In addition, one of the rules I teach my undergraduate students is to buy only stocks in an up-trend that are trading above their last green line top if they missed the break-out. Here are some weekly charts of examples of recent GLBs.
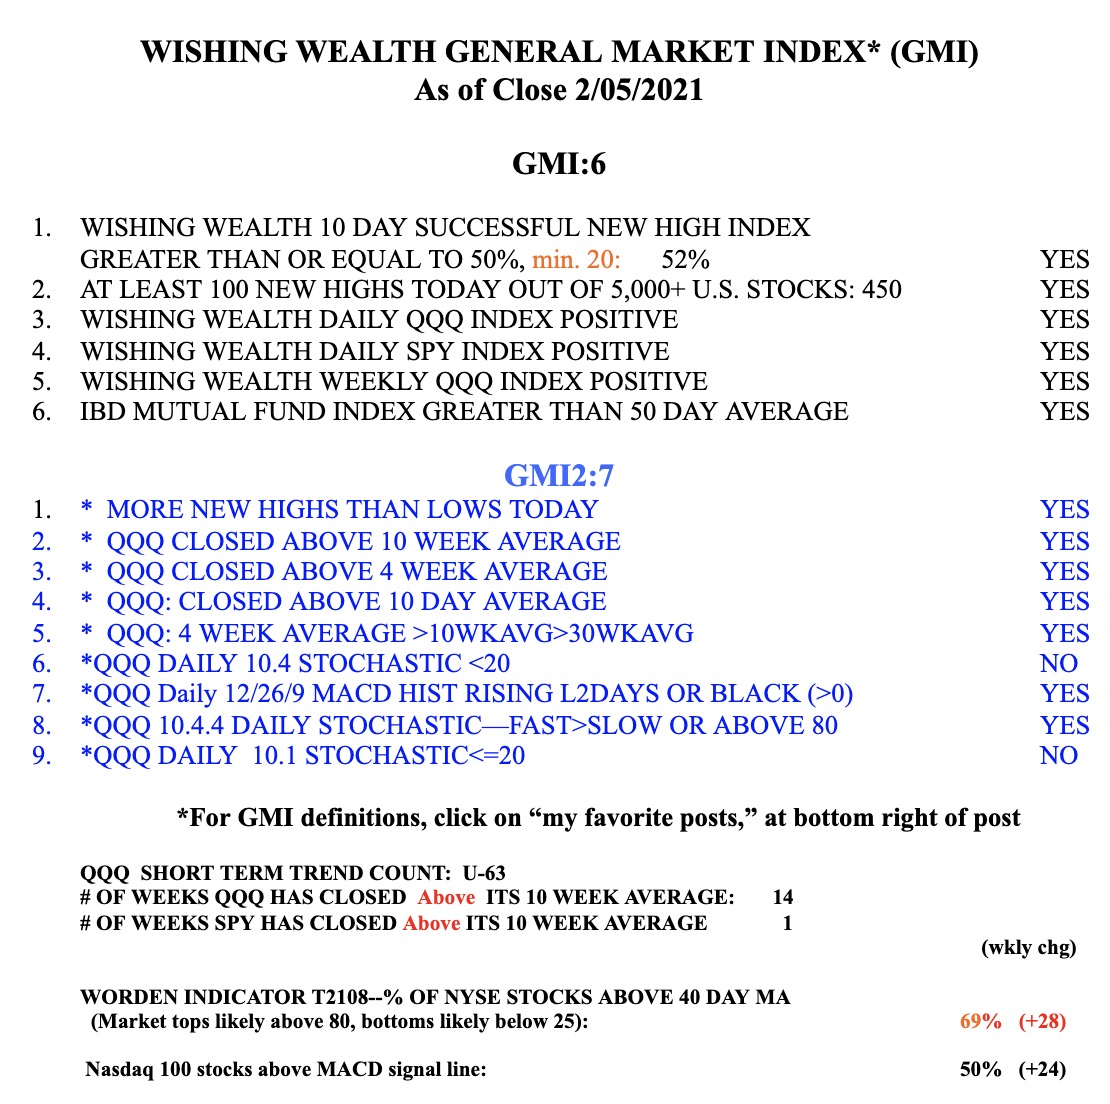
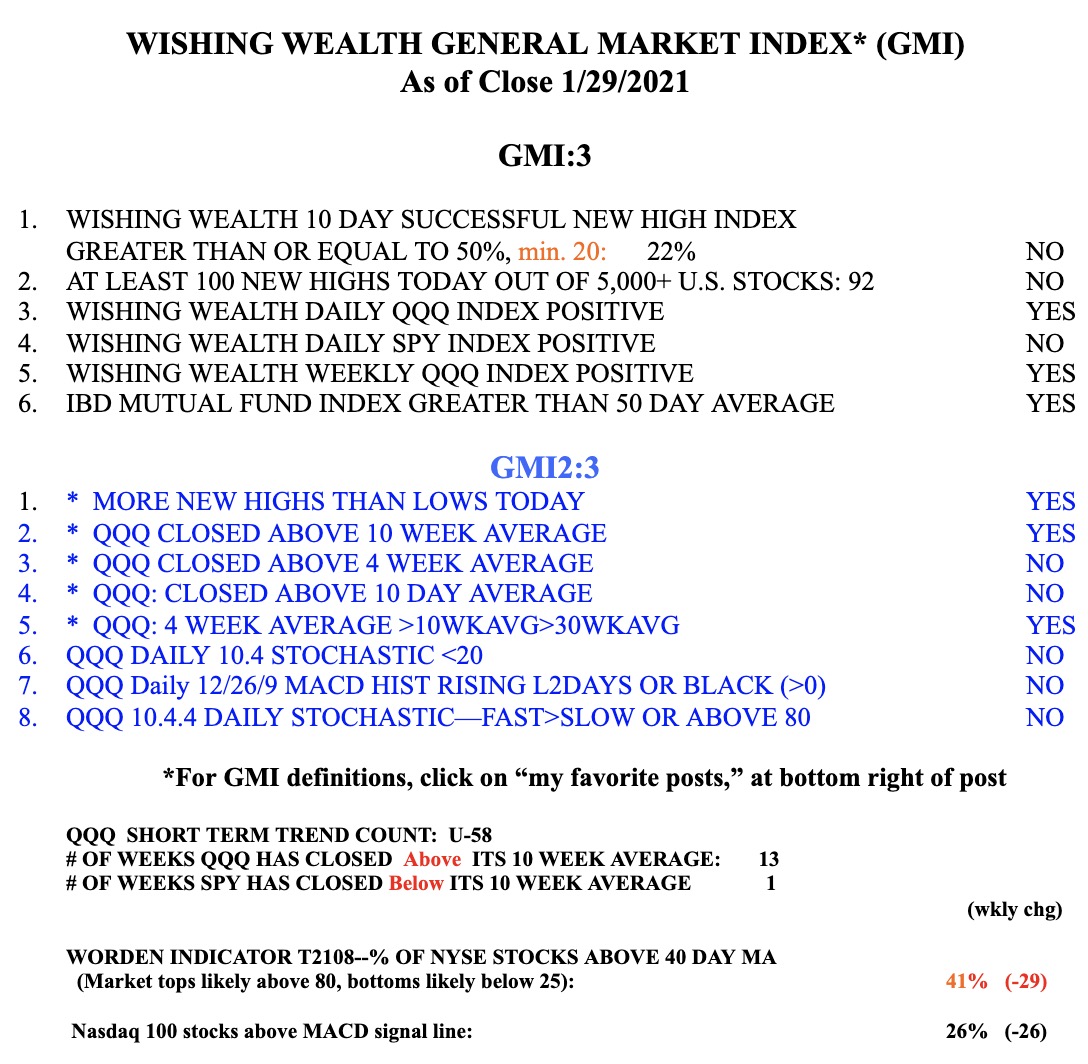
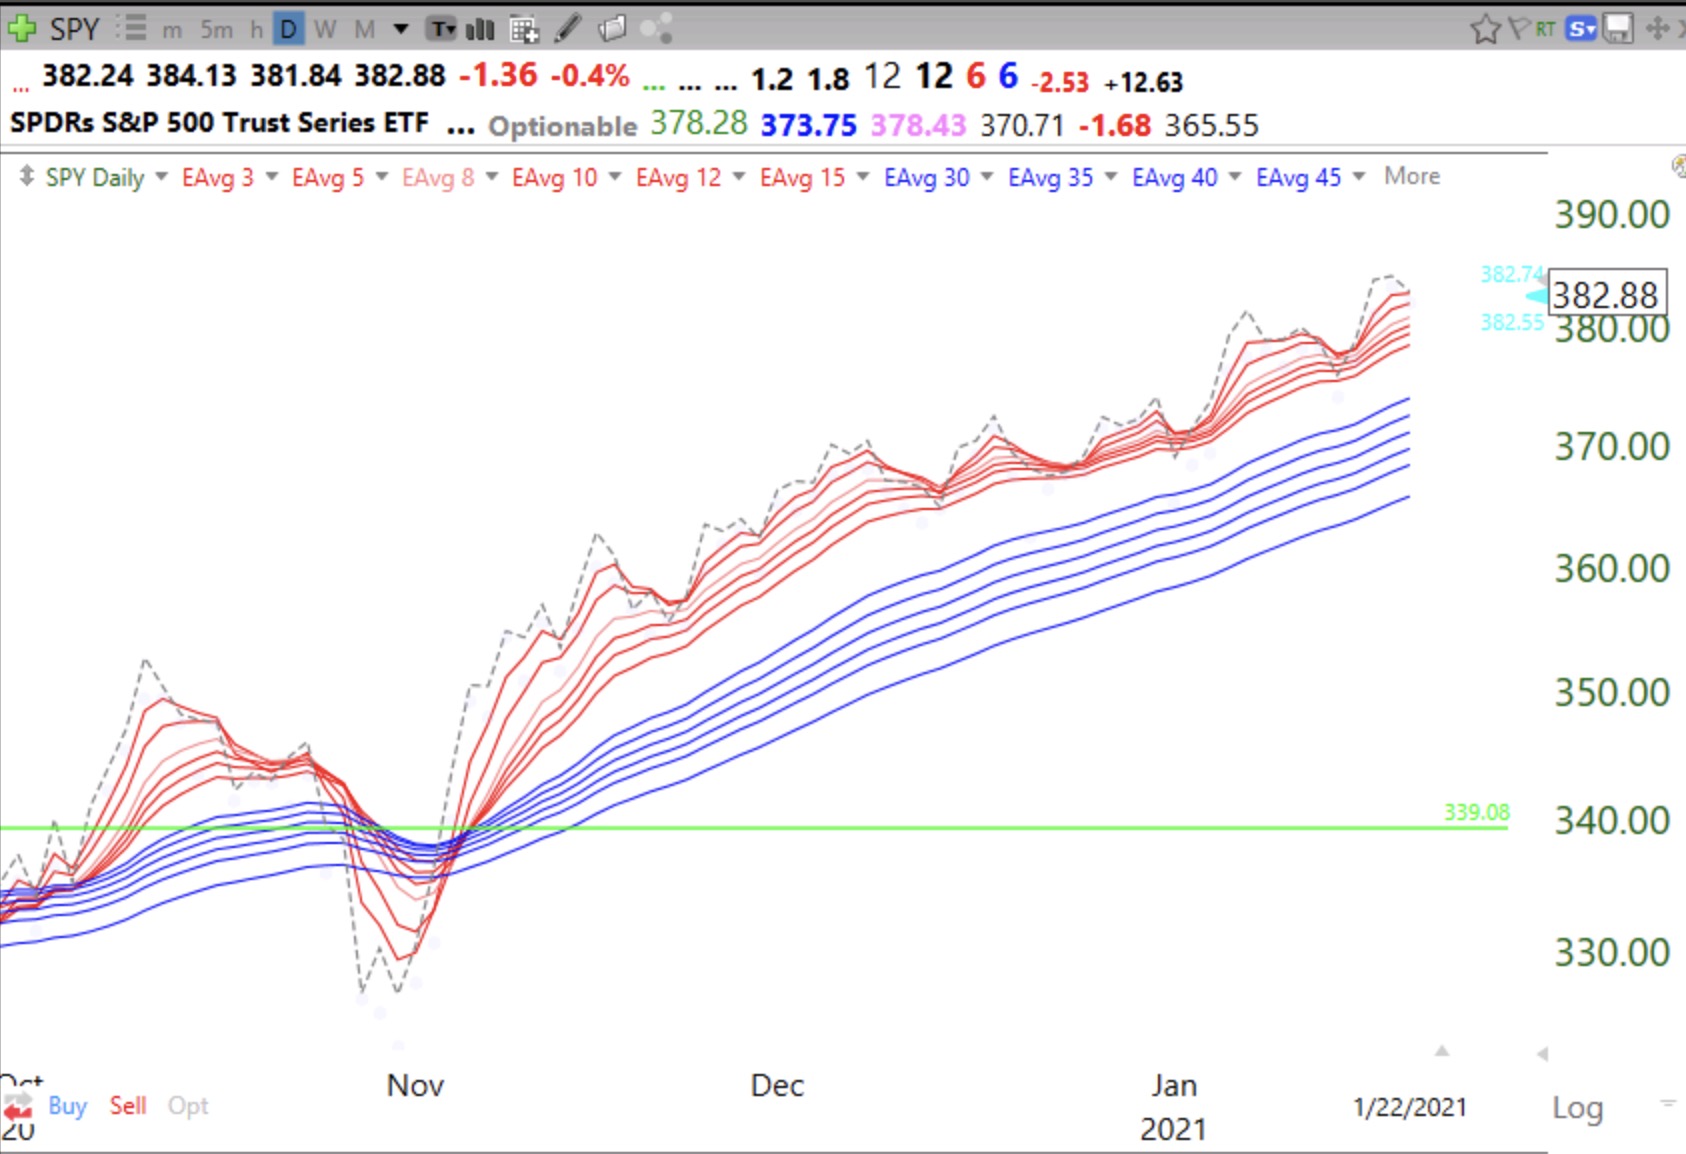
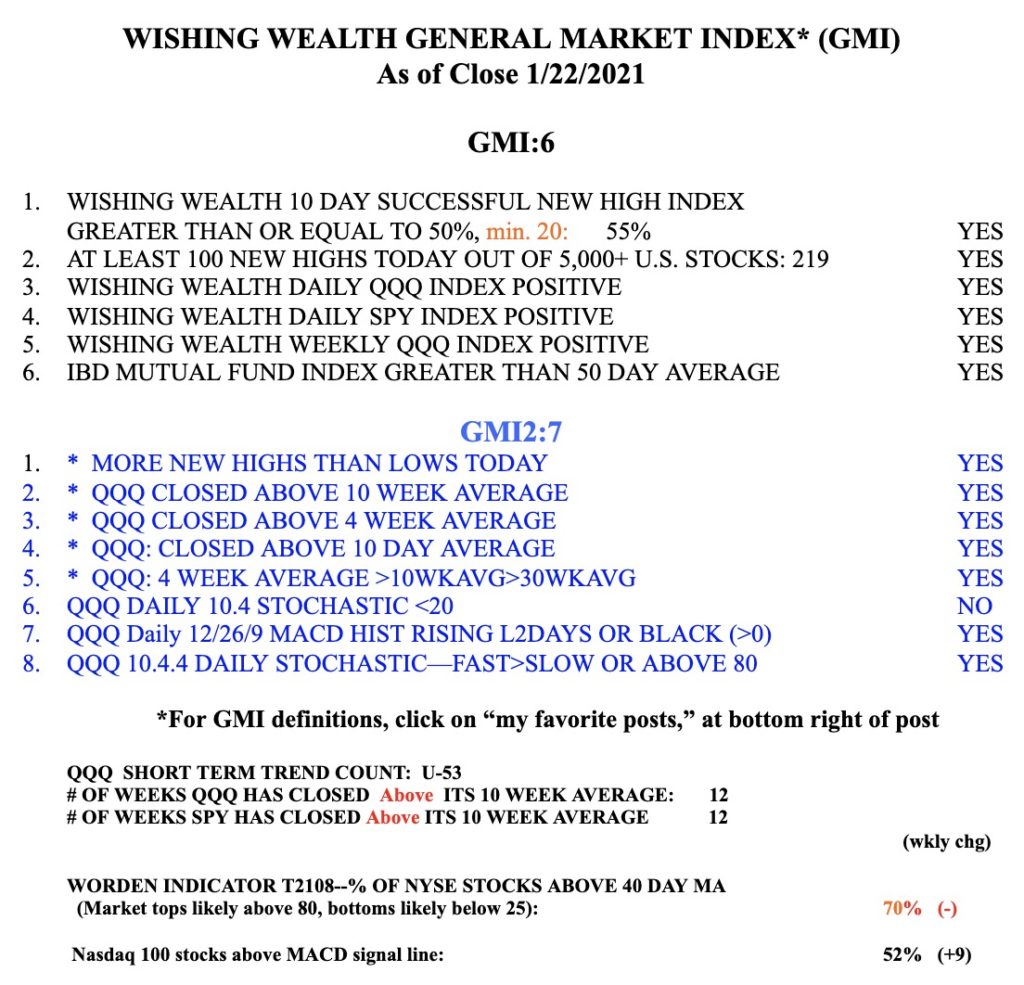
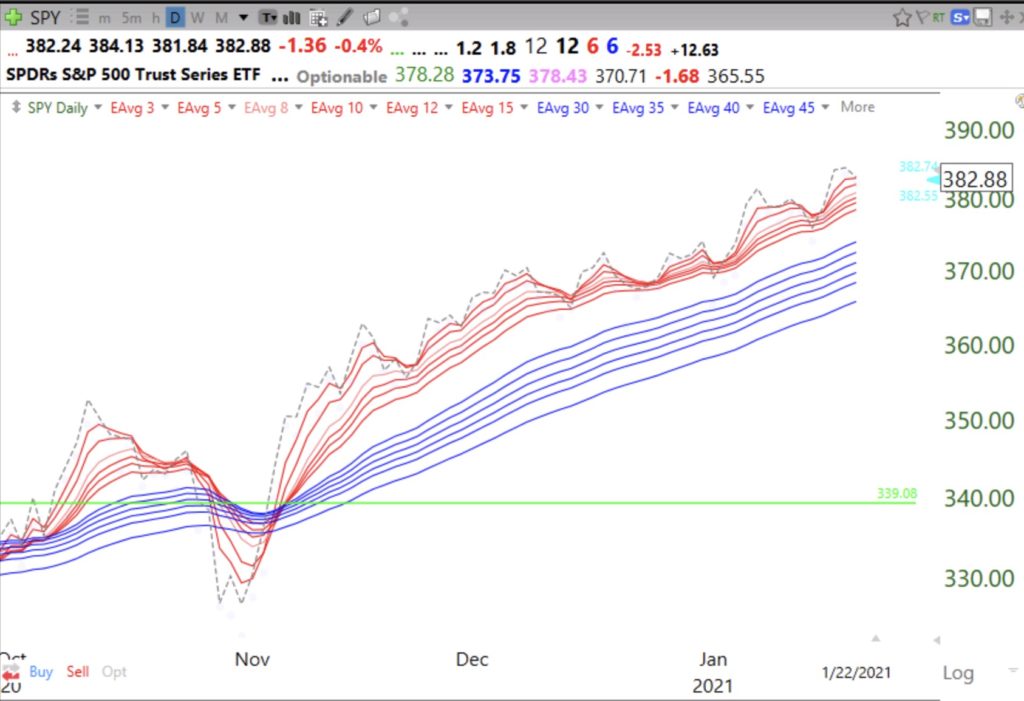
The GMI remains at 6 (of 6) and on a Green signal. SPY remains in a daily RWB up-trend pattern.
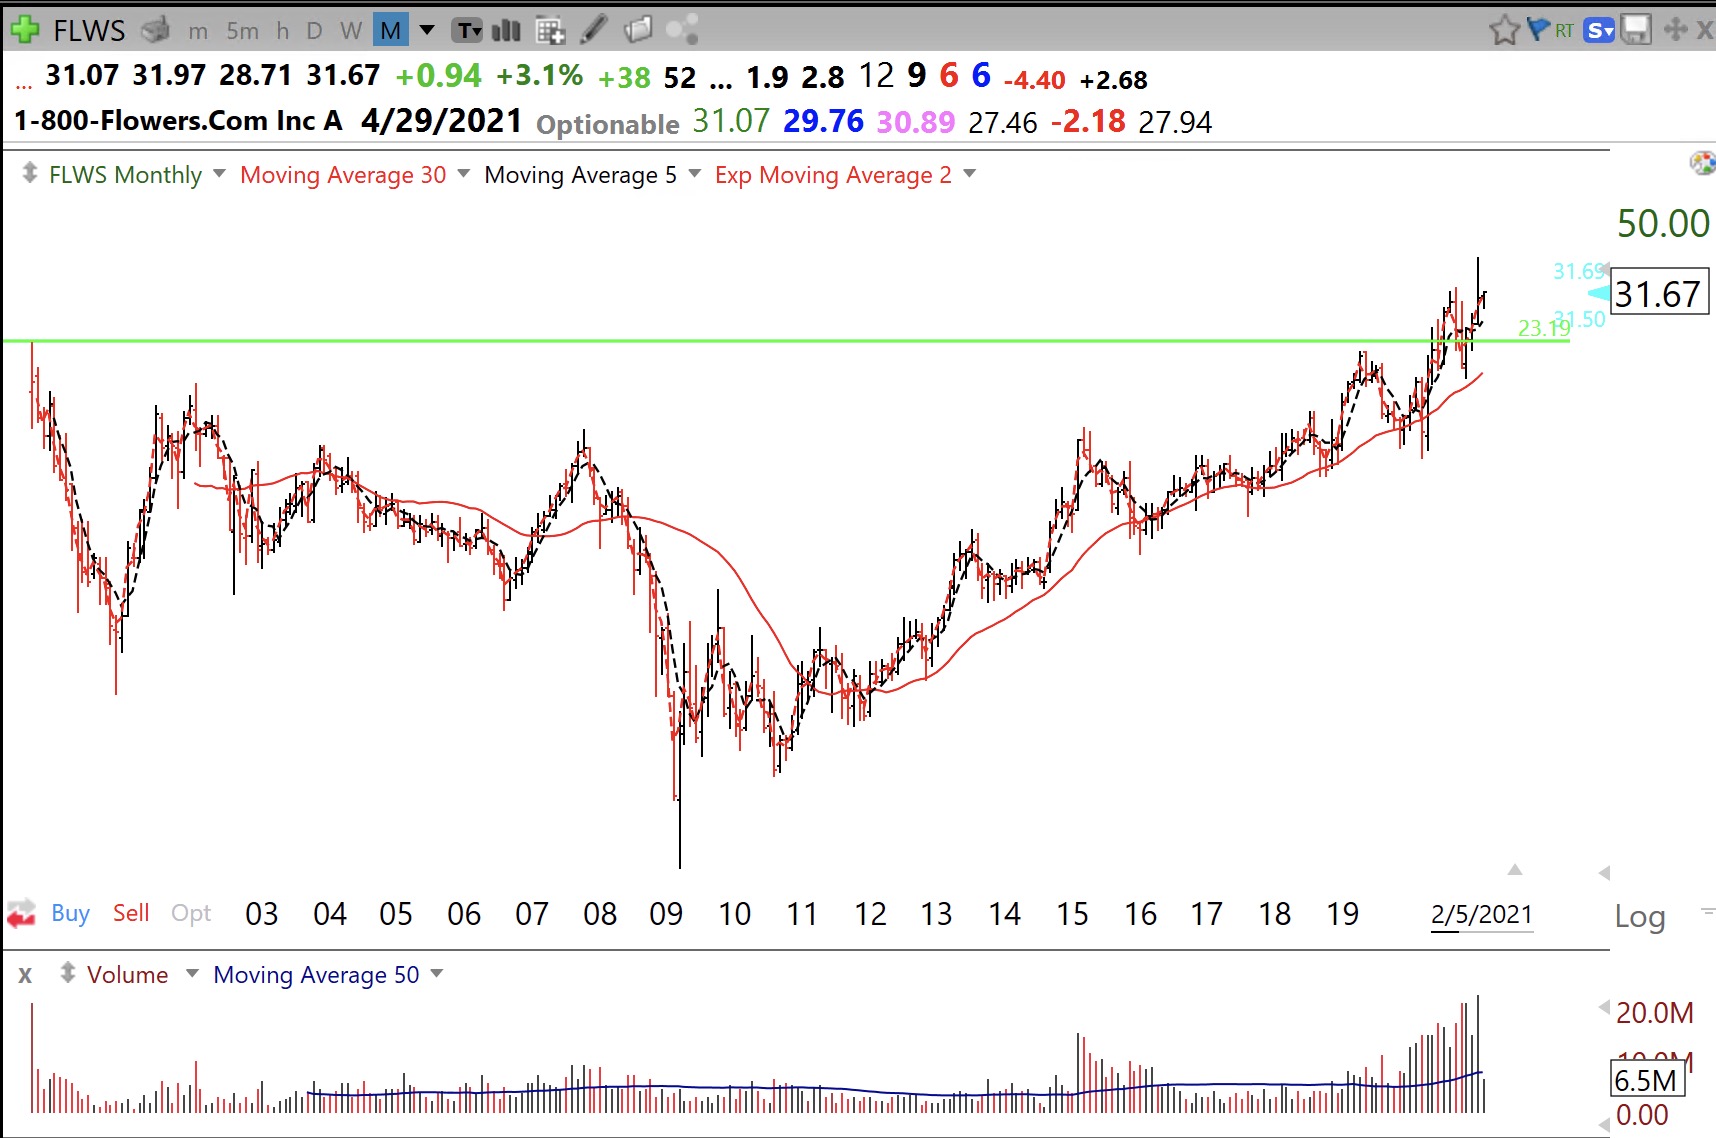
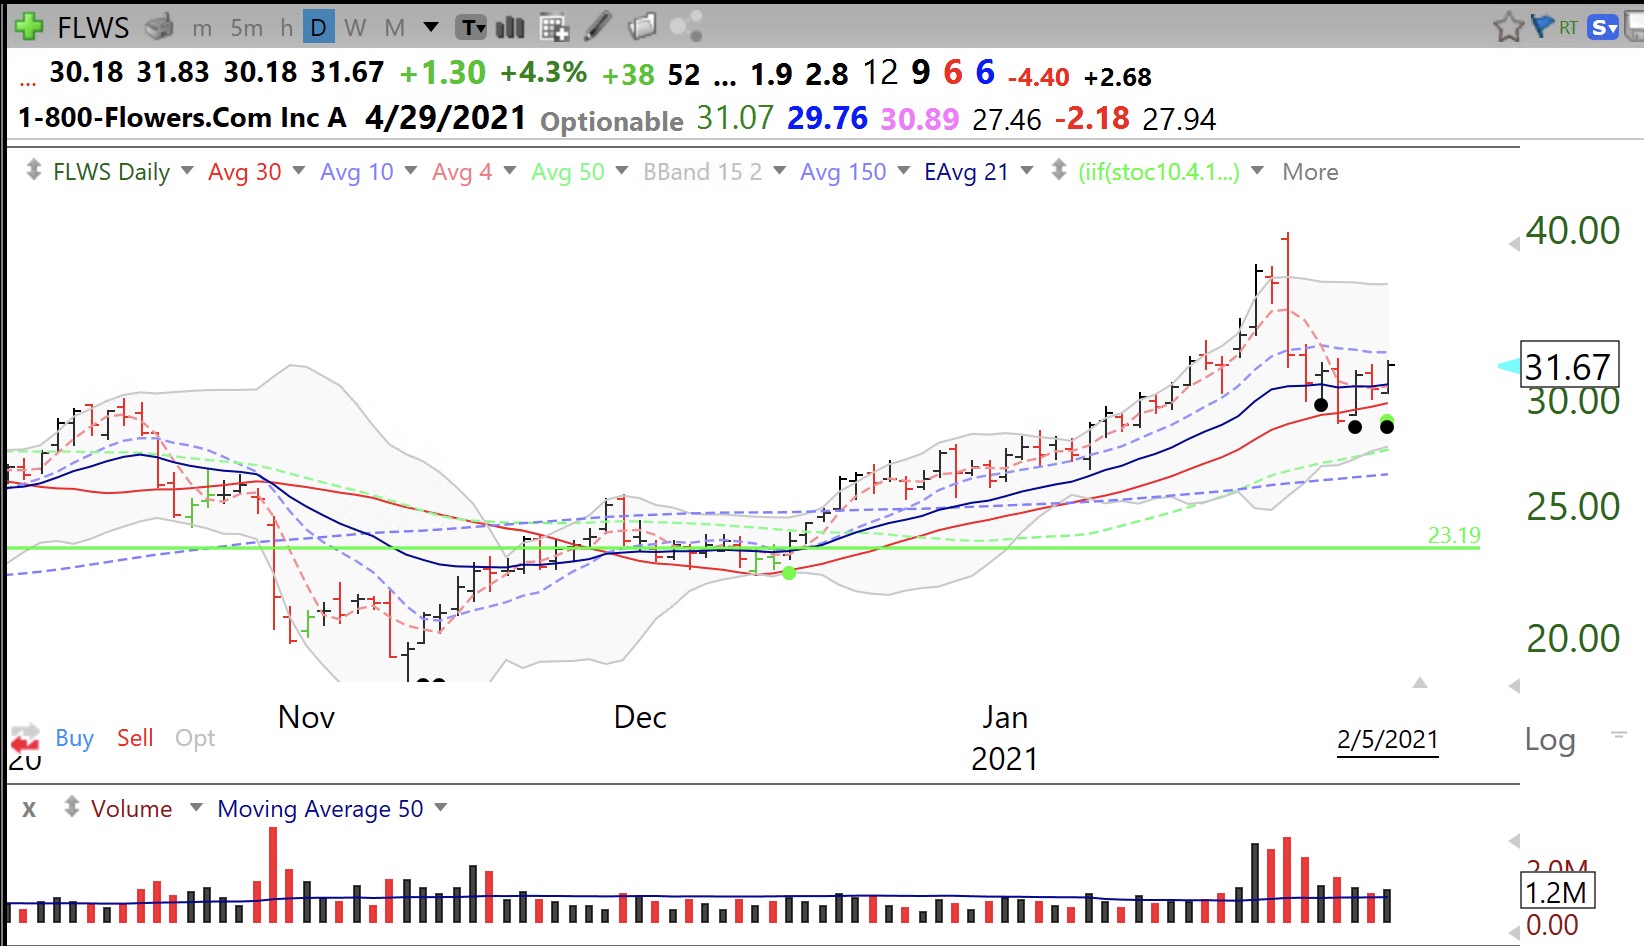 FLWS (1-800 Flowers) popped up in my scan for promising oversold stocks this weekend. With Valentines Day coming and people afraid to visit stores, is this business primed to blossom? Note it had a recent retest of its GLB to an ATH after it broke through its 1999 top and may now be getting ready to grow from oversold, as the green and black dots suggest. If one had bought the stock when it cam public, s/he would have had to wait 20 years to get their investment back! That is why I only buy IPOs when they have a GLB. It also had a WGB, not shown. Note also in the monthly chart below that it had increasing trading volume the past year. Buying an up-trending stock that may bounce from oversold levels can be a minimal risk strategy if one sells quickly if the stock breaks its nearby support. FLWS’ earnings are projected to grow +66% in 2021 (MarketSmith). Next earnings are expected 4/29/2021……..