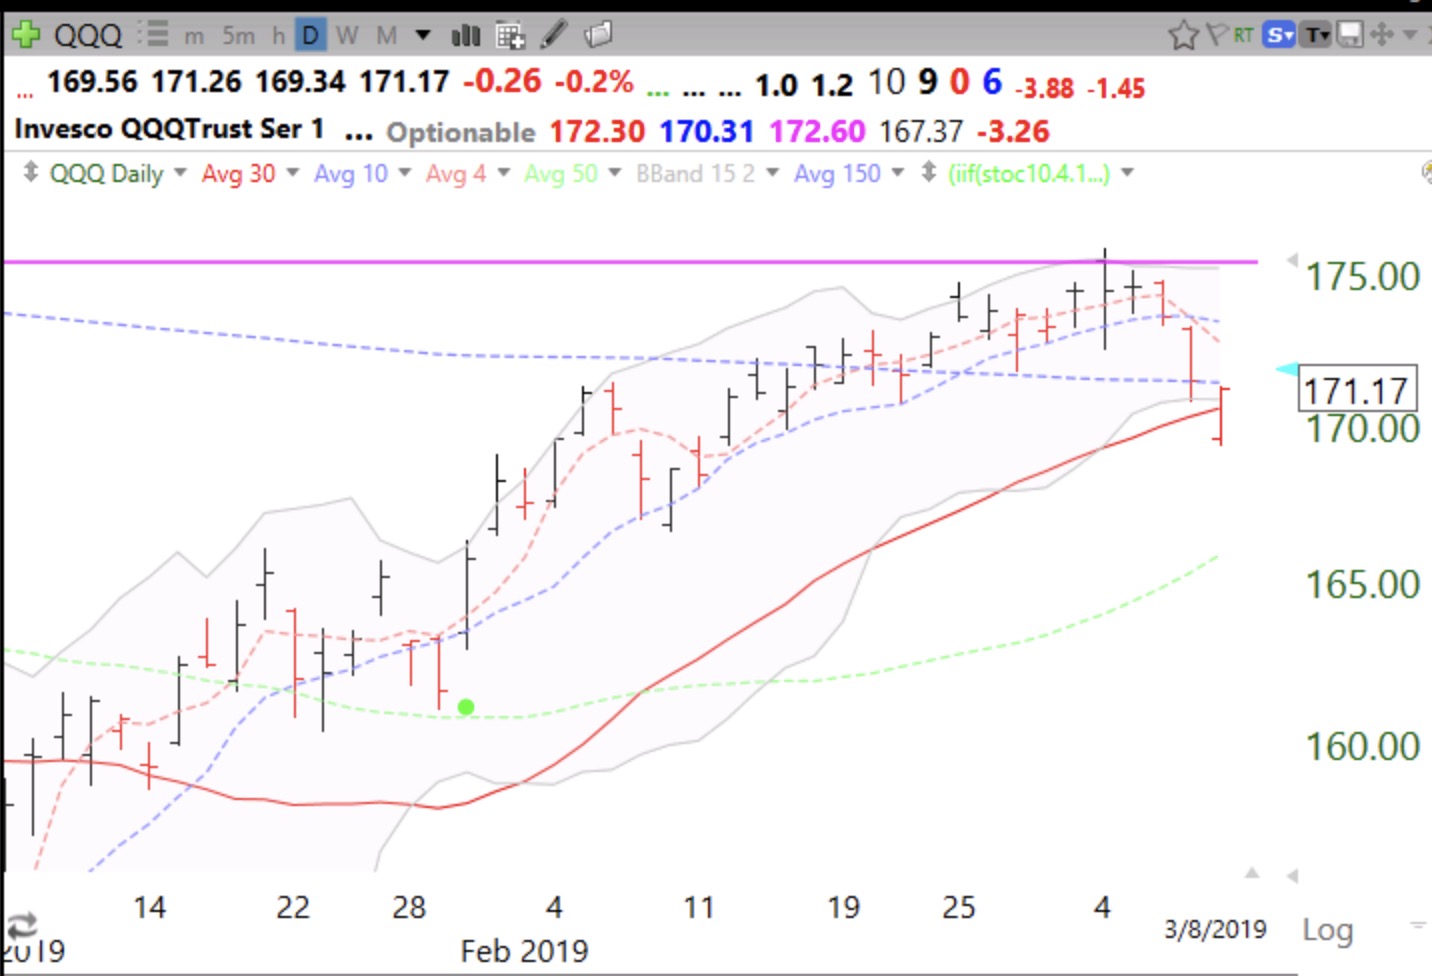
The last time so many stocks touched their bottom daily 15.2 Bollinger Band was last December, just before the recent rally. The QQQ index ETF also did so on Friday. Friday’s low must not be violated.
Stock Market Technical Indicators & Analysis
The last time so many stocks touched their bottom daily 15.2 Bollinger Band was last December, just before the recent rally. The QQQ index ETF also did so on Friday. Friday’s low must not be violated.
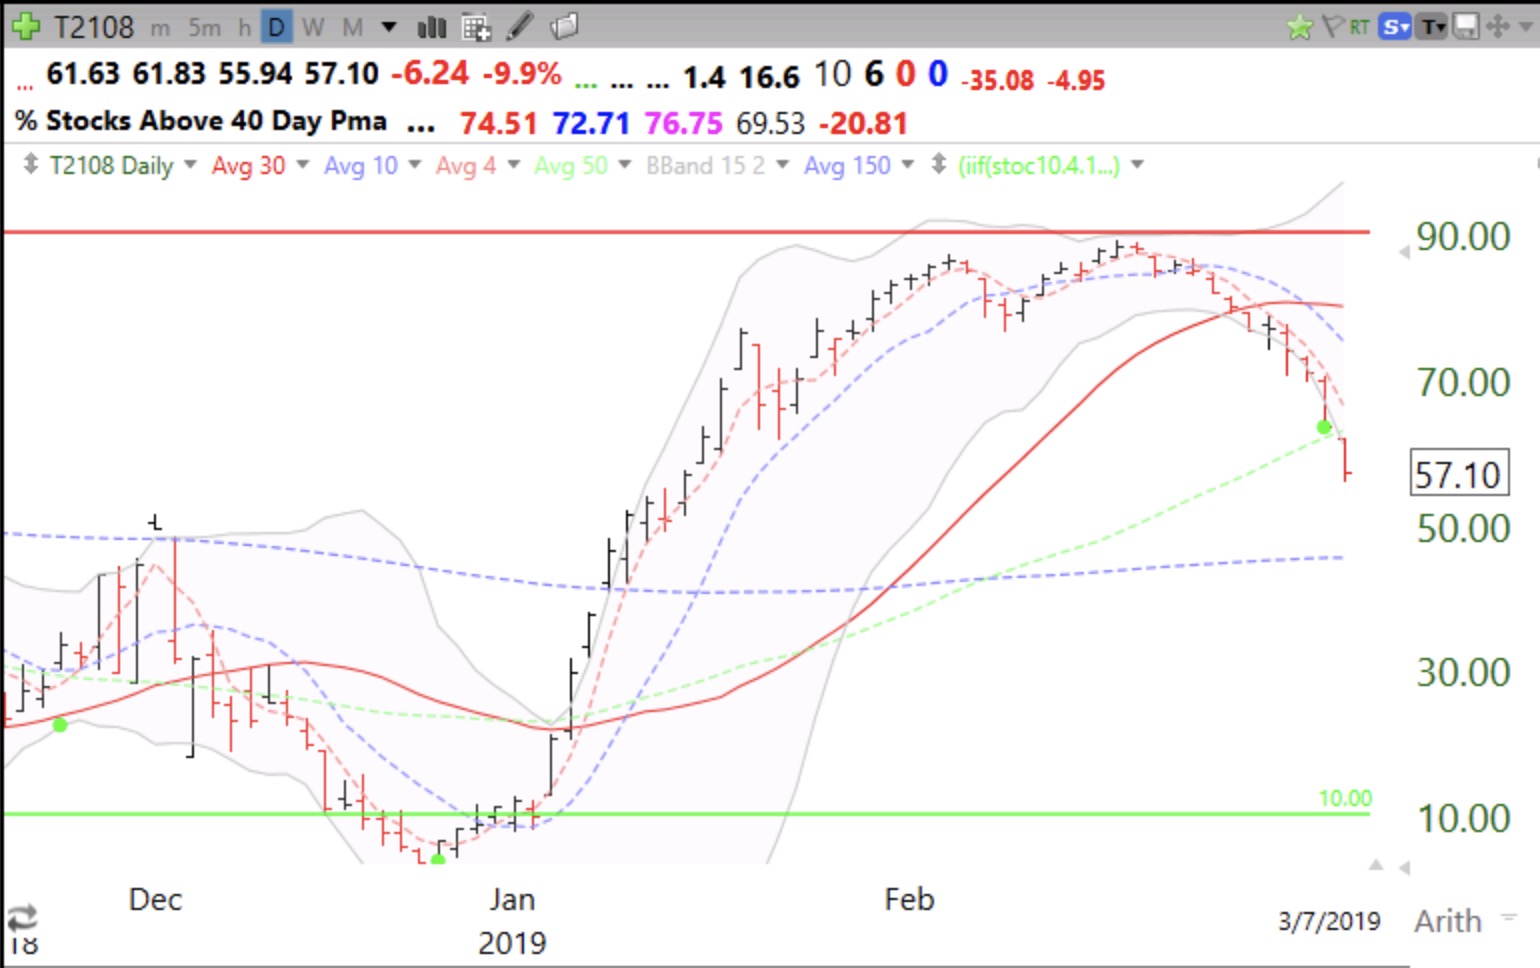
T2108 measures the percentage of NYSE stocks closing above their 40 day simple moving average. It acts like a pendulum of market sentiment. Hugely oversold is when T2108 reaches single digits. T2108 is available in Worden software.
The past 2 days there have been fewer than 100 new 52 week highs and there were more new lows than new highs yesterday. For now, profiting by buying stocks at new highs is a low probability bet. Maybe this post earnings lull decline will set up a rally when first quarter earnings come out in April? I am looking to buy bounces in late March.