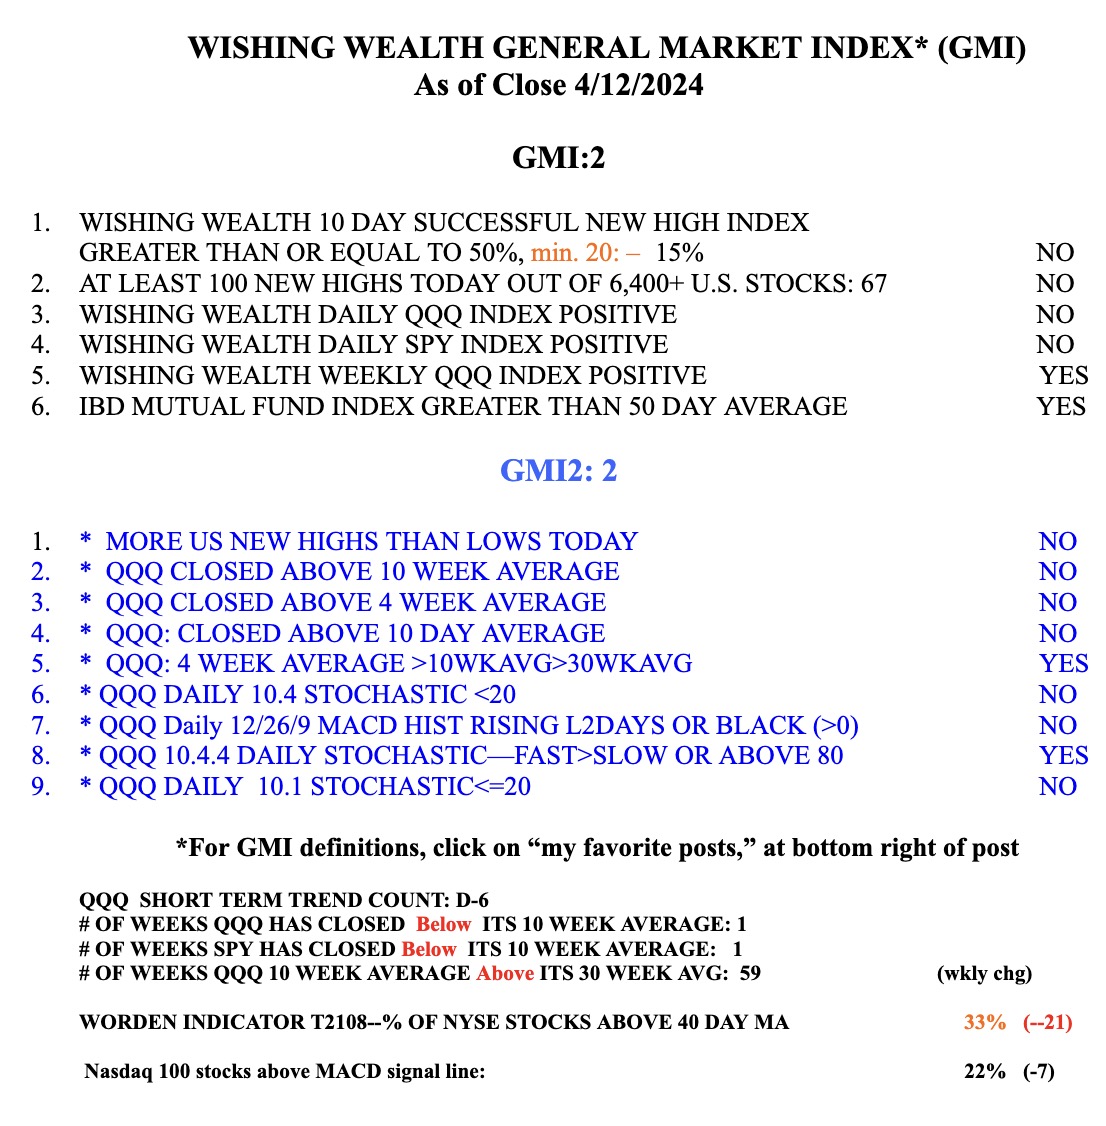
Archive for the ‘ All Posts ’ Category
Dive into the archives.
GMI remains at 6. Is it time to call this a resumption of the bull market?! This daily chart of GLD suggests that gold is at resistance. Will it resume its down-trend or break through?
GMI remains at 6 but T2108 is in overbought territory, at 84%. Fourteen stocks came up on my 52 week high with good earnings scan: CMG,TCO,WPZ,ASPS,HIBB,SIX,LECO,WYN,PZZA,AIT,CALM,FWRD,SE,INTC TCO appears to be a RWB stock breaking from a base. Click on chart to enlarge.
With the Worden T2108 at 83% and 95% of the Nasdaq 100 stocks closing above their 30 day averages, I am reluctant to take on more long positions now. I am selling calls on long positions and waiting for a drop to support to increase my long positions. Longer term up-trend is up but I [...]
Stocks are breaking out and showing a lot of strength. Only cloud on the horizon is the T2108, now at 83%, an overbought level where tops tend to occur. Fifteen stocks showed up on my Darvas scan: VHI,EXXI,AREX,CLR,FICO,AE,TNH,ZOLL,JAZZ,FARO,DXPE,ALXN,URI,WCG,RGR All but WCG are near all-time highs. They have great technical strength and recent earnings and are [...]
Short and longer term up-trends are in place. Note, however, that the T2108 is pushing 80%.
My indicators remain positive and I am 100% invested in mutual funds in my university pension account. I am gradually accumulating long positions in my trading accounts. The GMI is at 5 and and the GMI-2 is at 6 (of 6). The GMI gave a buy signal on December 23rd and is still in place. [...]
T2108 breaks 80%, in overbought territory, and about one half of Nasdaq 100 and Dow 30 stocks have an overbought stochastics reading. Still, the GMI buy signal of 12/23 remains firmly in place. Among the 17 stocks hitting a new high on Thursday and having very good fundamentals are: NEU, ADS, ARG, DCI, PETM, SBUX, [...]
Up-trend continues. The GMI buy signal of December 23rd is still in place. Since 12/23, the QQQ has advanced +3.7%, the QLD by +7.5% and the TYH by +9.1%. AAPL has risen +4.8%. Among the S%P 500 stocks, only 15% have risen 7% or more. In an up-trend it still works better to just buy [...]
I monitor the Worden T2108 Indicator and the Investors Intelligence poll to assess if the market has reached an extreme level of bearishness or bullishness. The T2108 closed Tuesday at 79%. This is close to the level where prior market rallies have topped out. Similarly, far more advisers are bullish than bearish (49.5% vs. 30.5%). [...]
Both the GMI and GMI-2 are at 6 (of 6). The short and longer term trends remain up. See the weekly GMMA chart of the S&P500 stock index. The short term averages (red) are rising above the longer term averages (blue). Click on chart to enlarge.


