 Dr. Wish
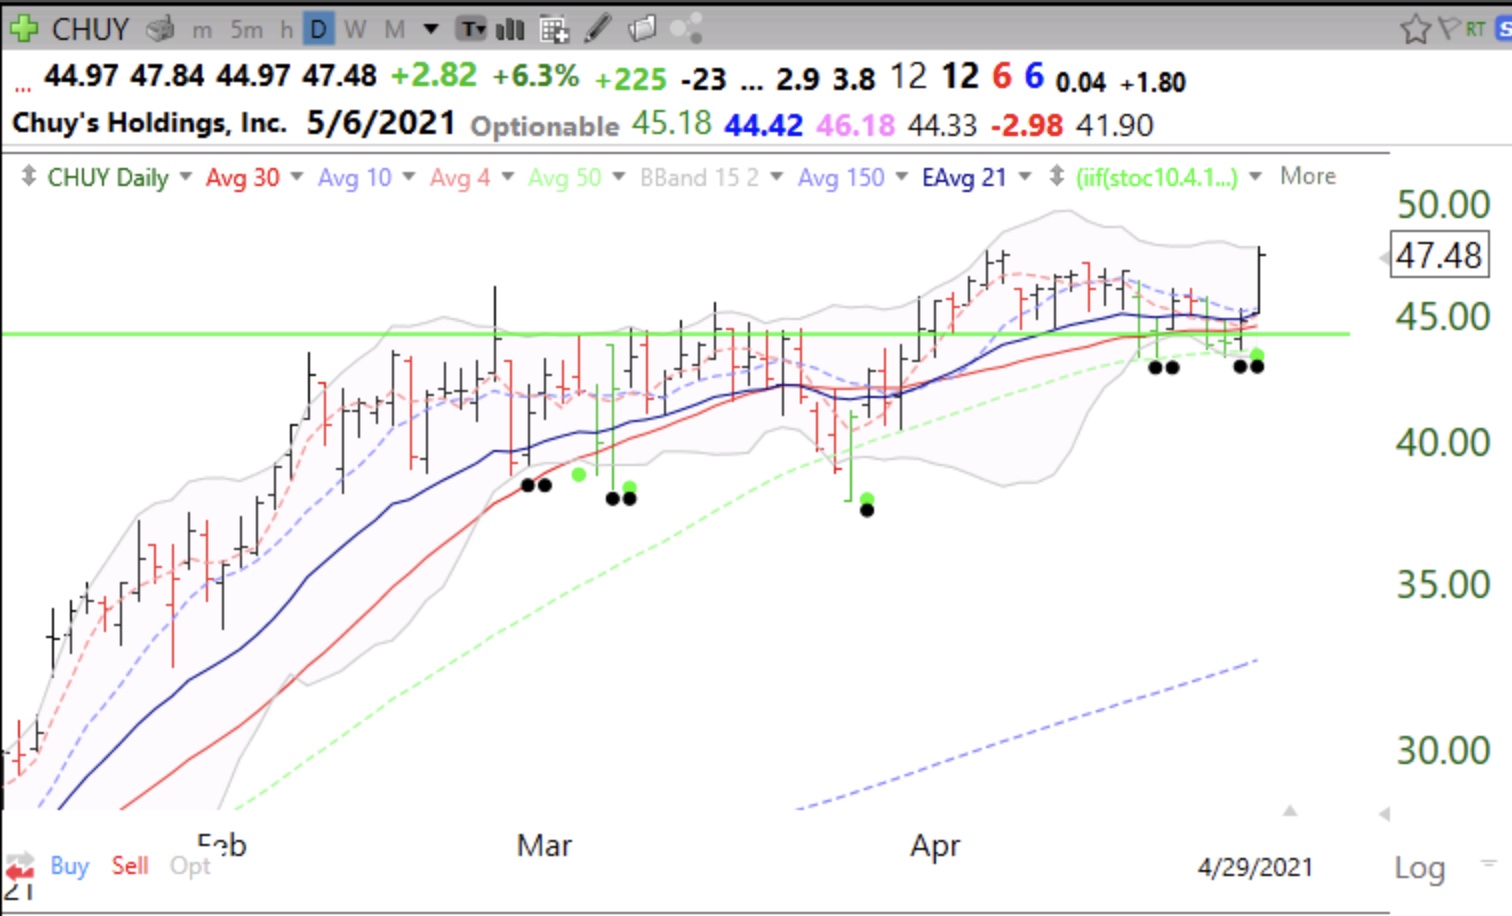
Blog post: There were 469 new highs among US stocks, the most since March 18, so many stocks are doing well; $FDX had a cup and handle break-out; $CHUY, $FB moving up after retesting GLB; GLB defined
I would have liked to see higher volume on this break-out, but FDX broke out after re-testing its last green line break-out (GLB). There is a new green line peak at 305.69 where one would expect some resistance. So this rise could continue to that level. I would then wait to see if it can have a new GLB. I tweeted about FDX intraday. You may follow my tweets @wishingwealth.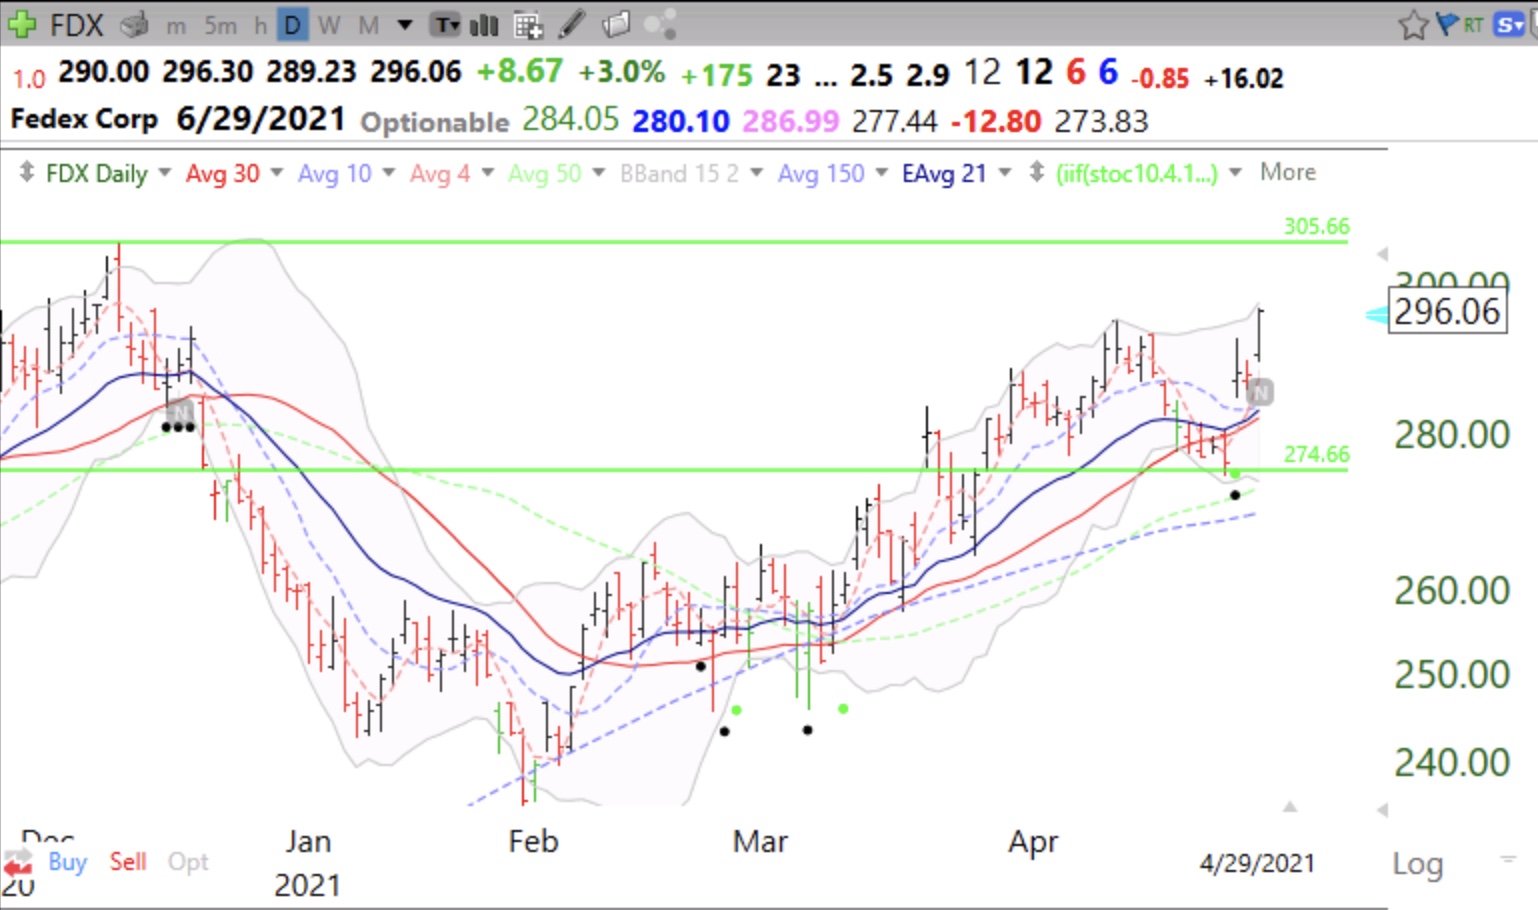
Another stock that is advancing after a retest of its GLB is $CHUY. Not sure of its fundamentals though.
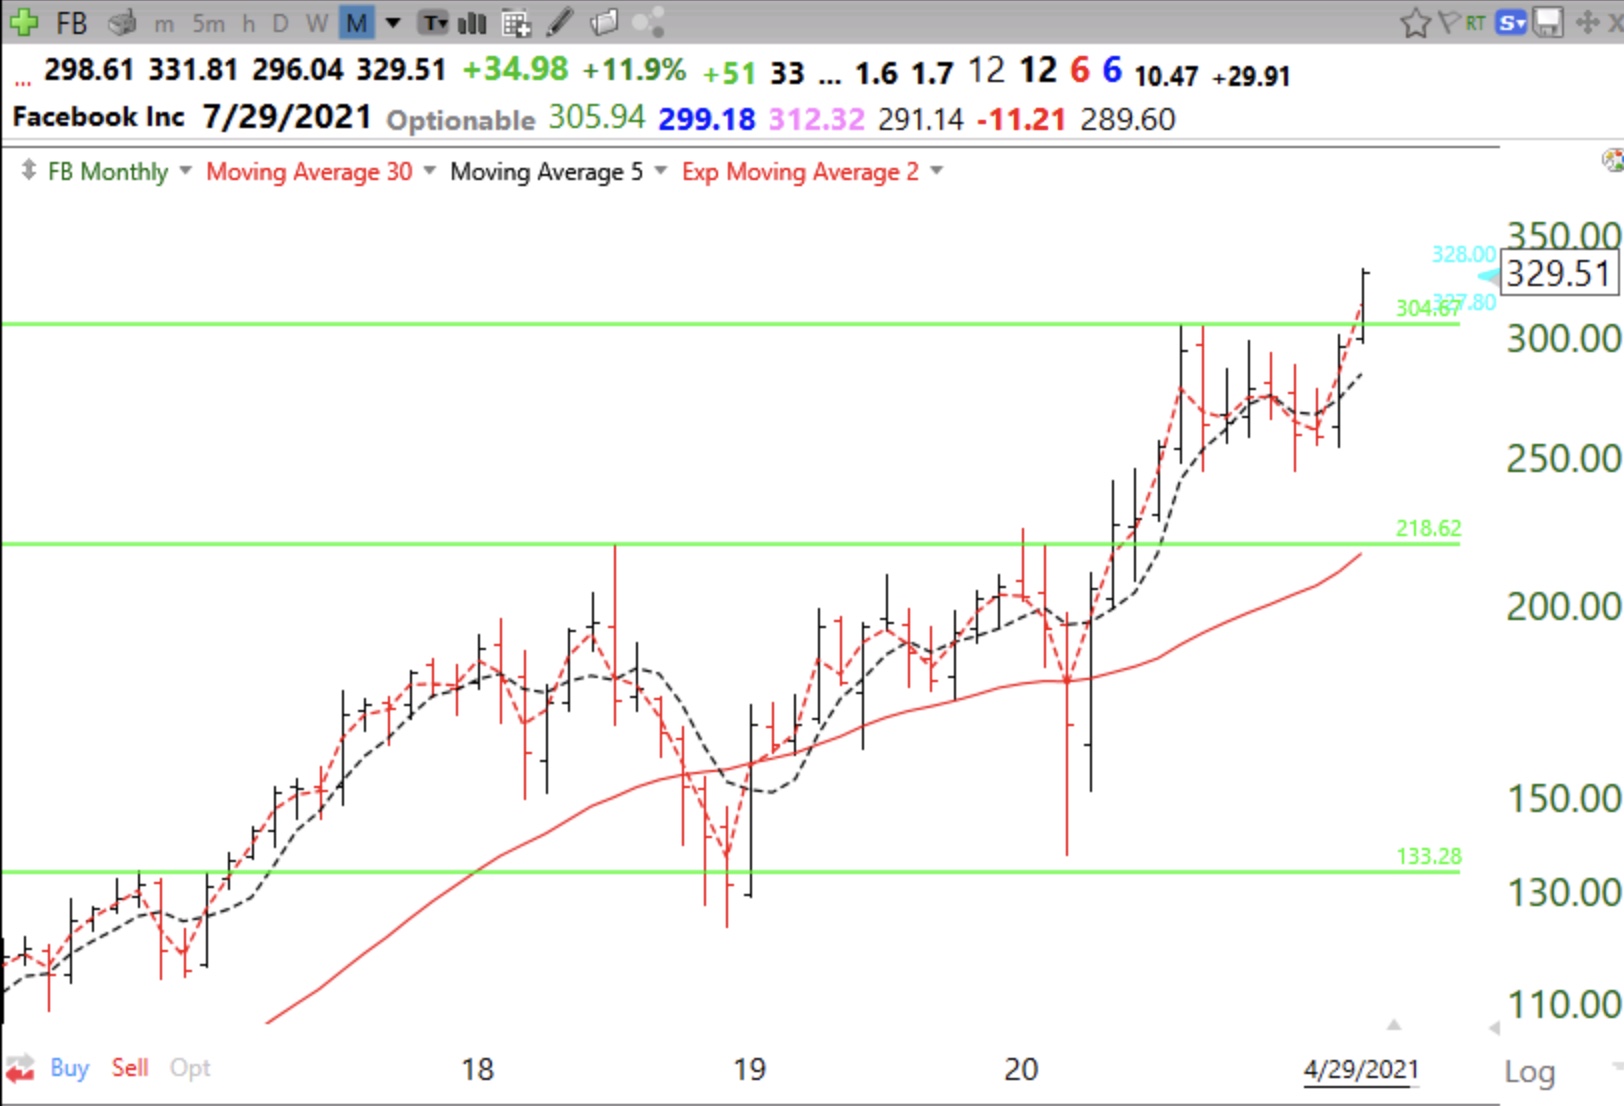
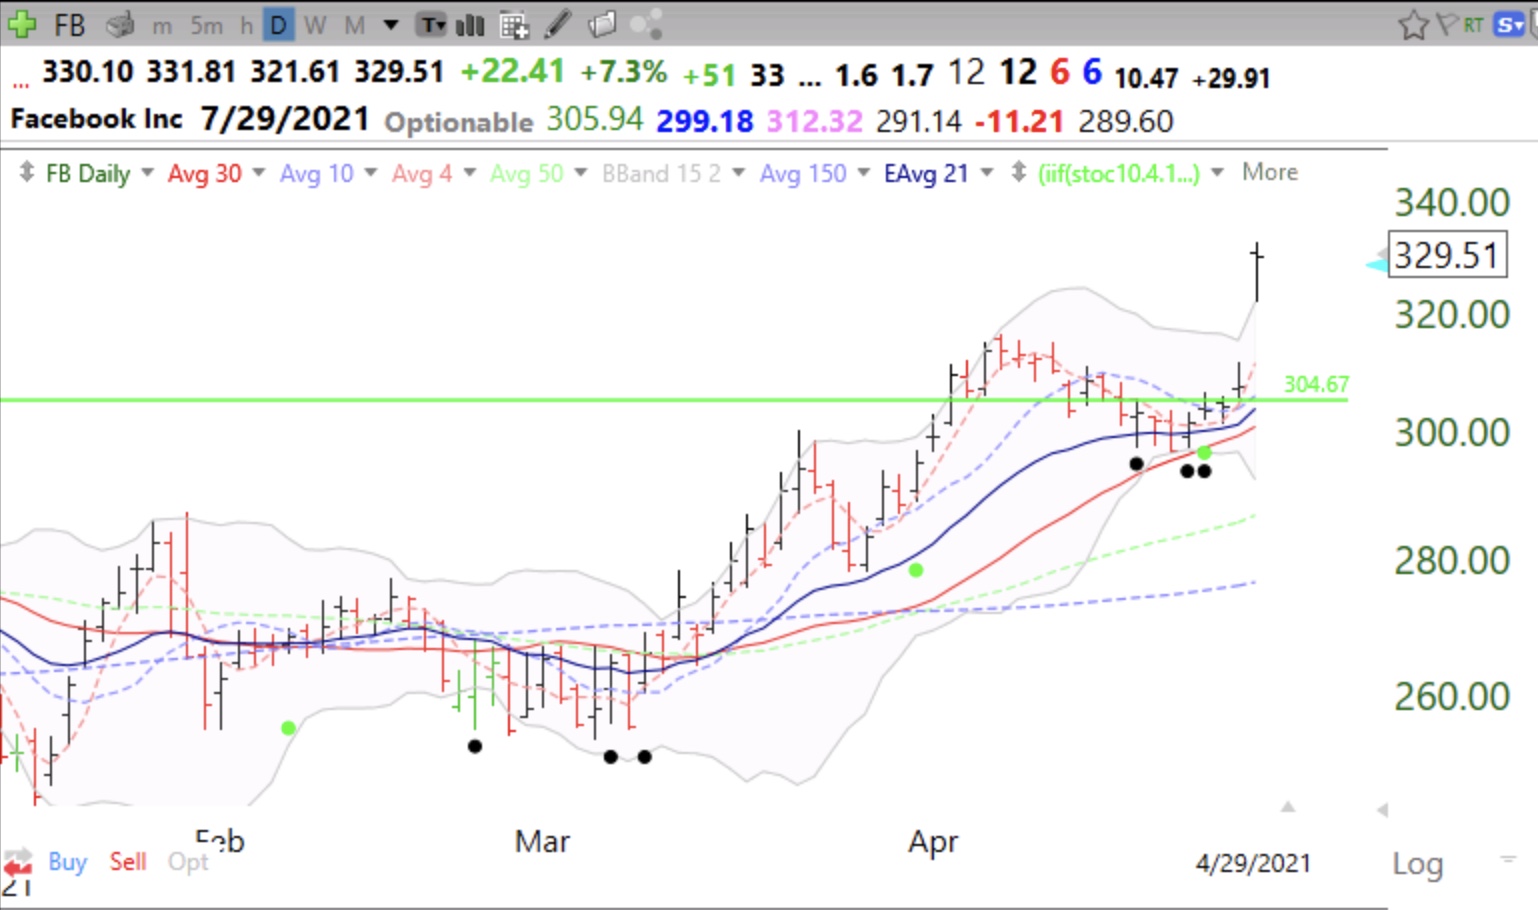
$FB has also retaken its green line. Understanding the GLB can lead to some large gains. From my glossary:
Green Line Breakout (GLB)
I draw a green line on a monthly stock chart at a bar at an all-time high that has not been penetrated (or closed above) for three straight months (or 3 bars). It basically is a strong stock breaking out to an all-time high (ATH) after at least a 3-month consolidation. Green line breakout stocks, in my experience, often go on to make a series of new highs as they rocket toward the moon. Most stocks I purchase are near or above their last green line top.
Here are the monthly and daily charts for FB.
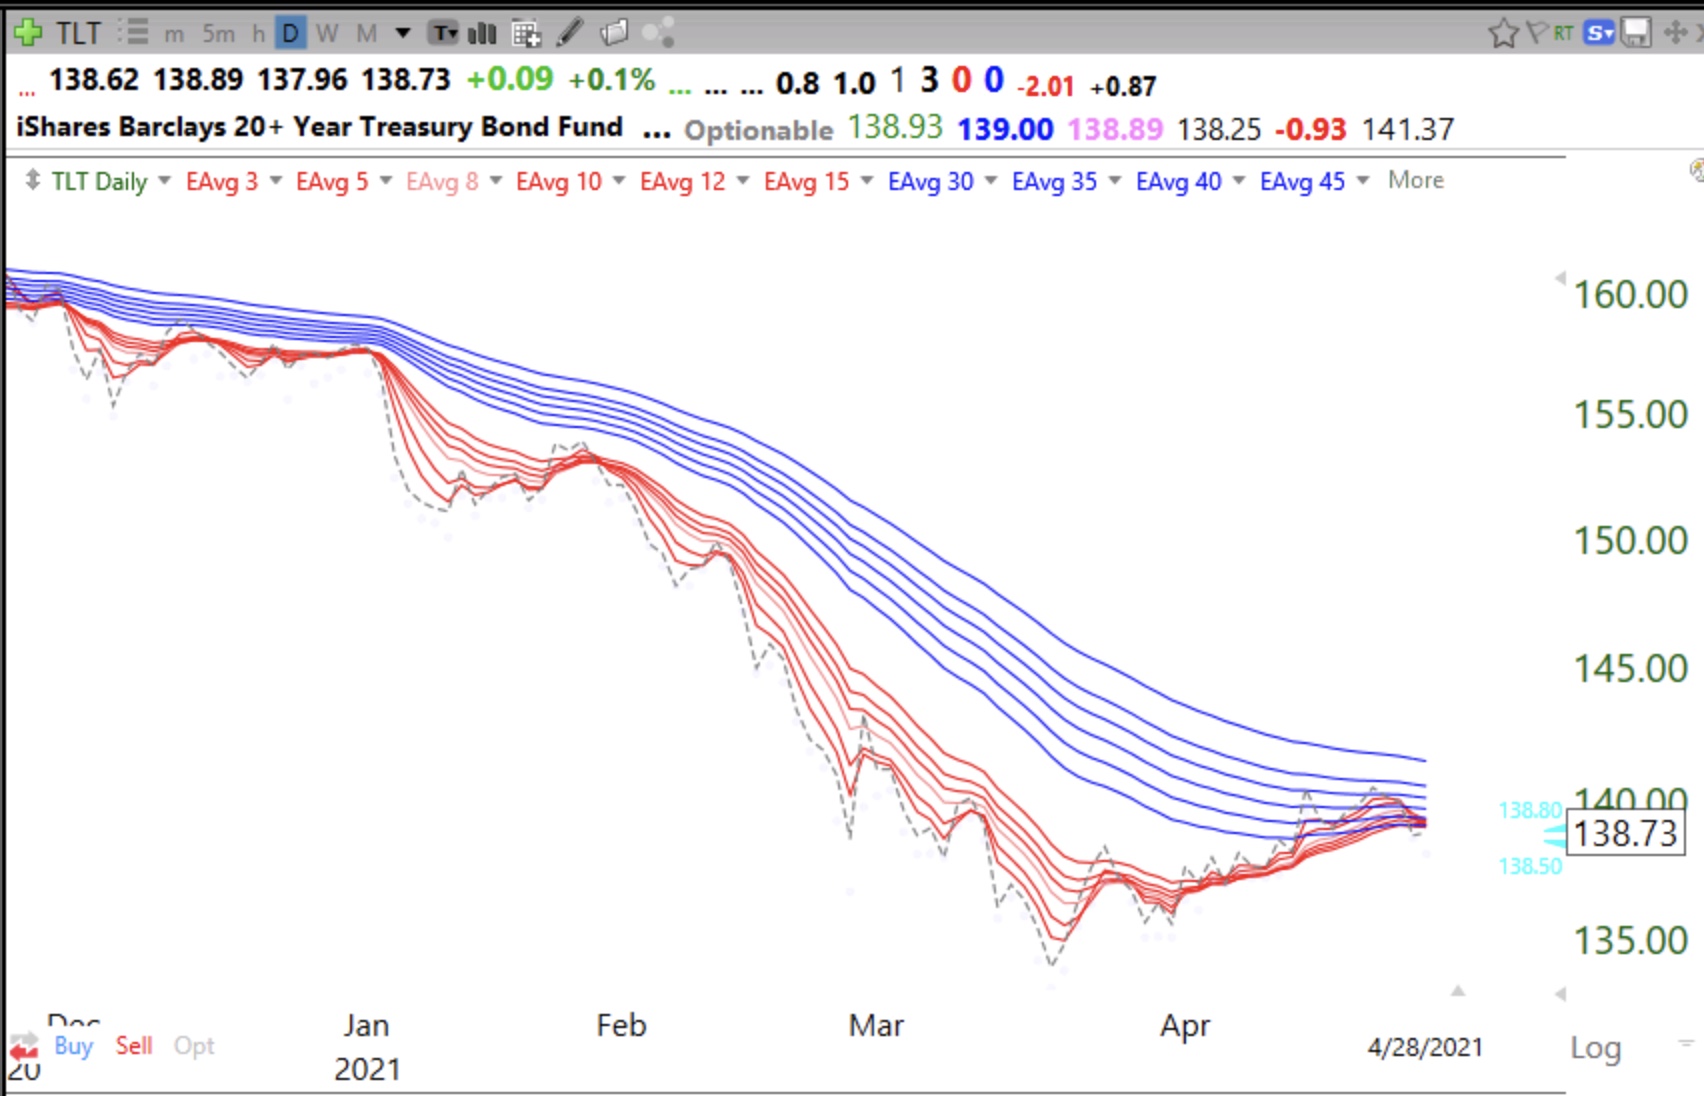
Blog post: Bonds weakening again, rising interest rates to challenge the bull; Sell in May is on the horizon
It has been very difficult to make money with my set-ups. The market has become very tough and I am mainly in cash in my trading accounts. TLT, 20 yr bonds, may be weakening again, a bad sign for stocks. And Sell in May and come back at Haloween is upon us. Most market gains occur between November and April. Be careful and save money for a stronger market.