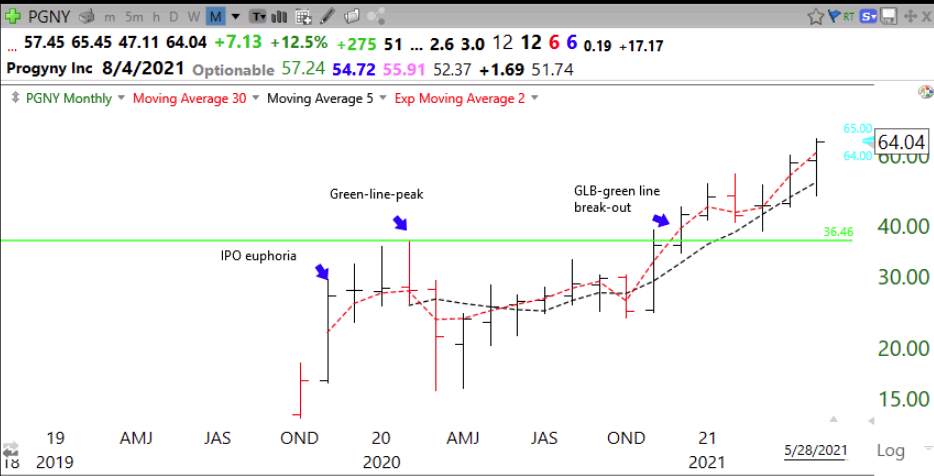
One of the most important innovations I developed was the GLB or green line break-out. I like to buy stocks that have advanced to an all-time-high (ATH), consolidated for at least 3 months, and then break out to close at a new ATH. I use TC2000 to draw in the green line on a monthly chart at an ATH and alert me the moment the stock trades above the line. A green line can only be drawn after 3 months (3 monthly bars) have passed since a peak price bar that has not been surpassed (see monthly chart below). I make an exception for recent IPOs when the green line may be drawn after consolidating a few weeks after reaching a peak ATH.
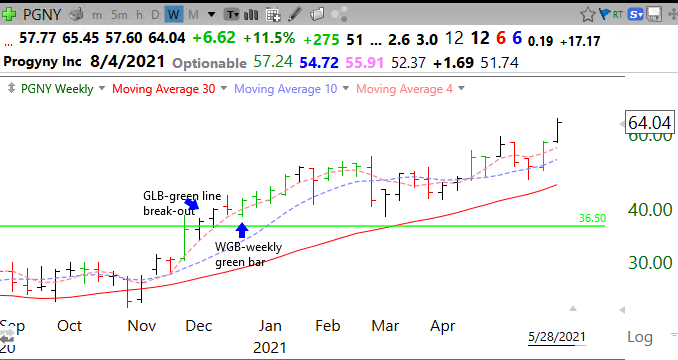
Last December, I posted a weekly chart showing that PGNY had had a GLB at 36.50 and a weekly green bar (WGB). PGNY closed Friday at $64.04, 75% above its GLB.
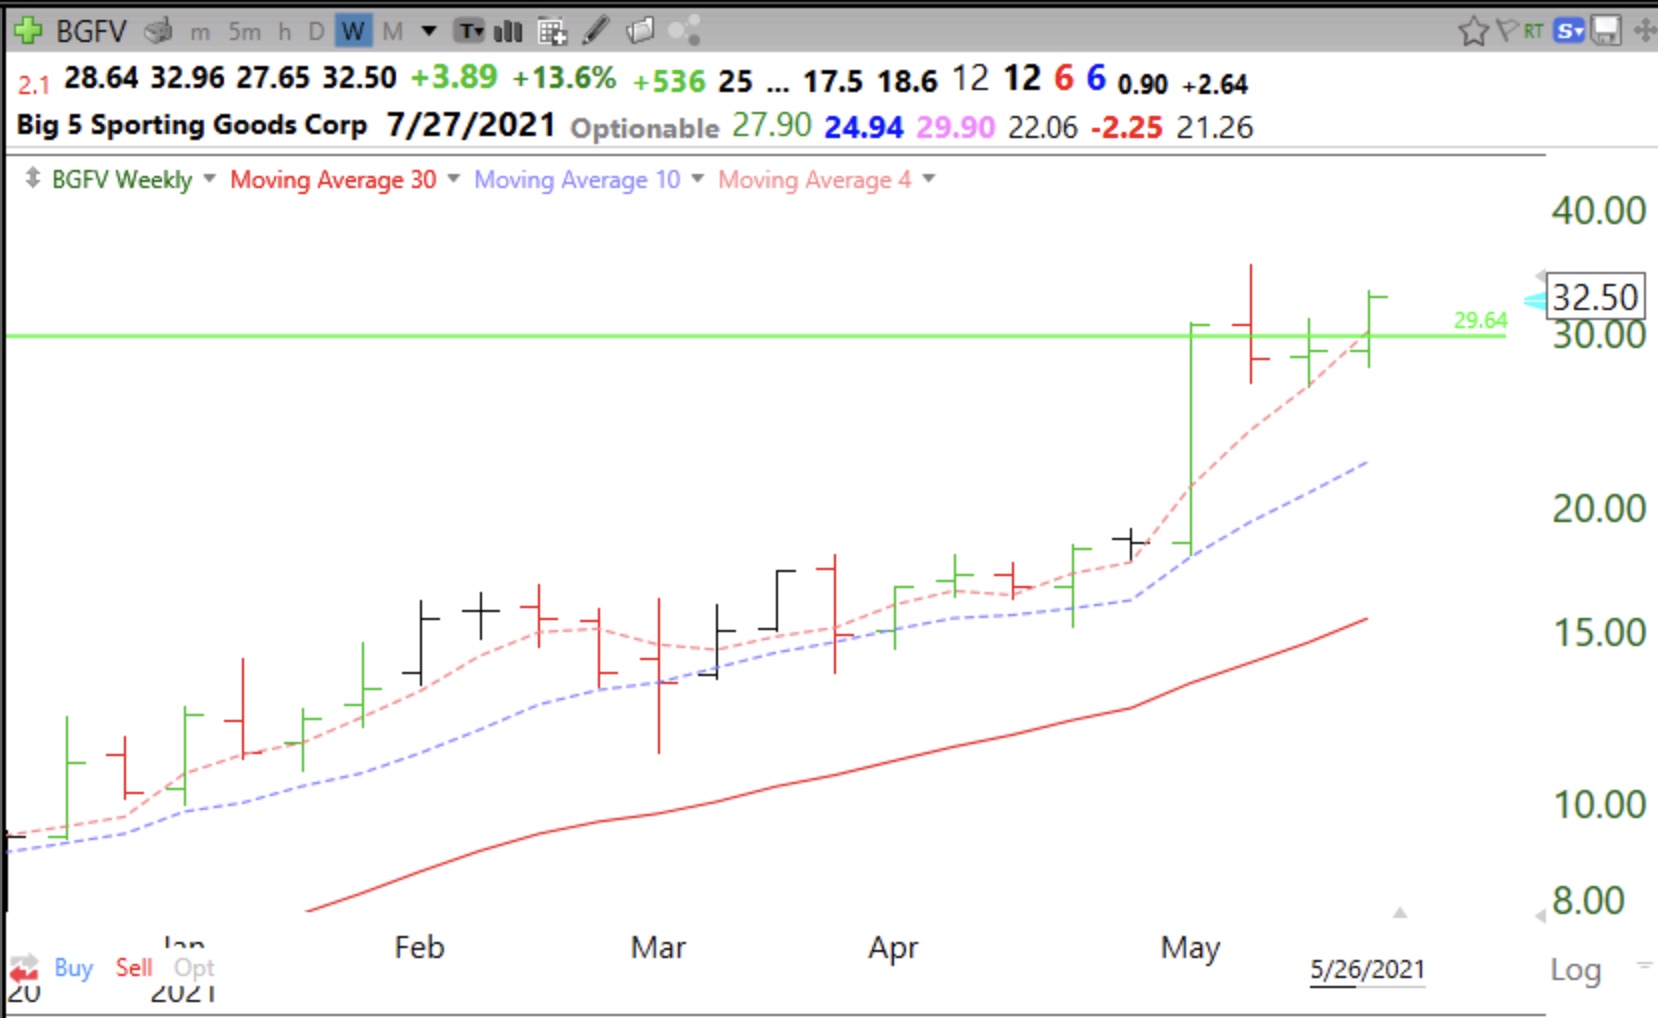
Here is its monthly chart showing where the green line was drawn.
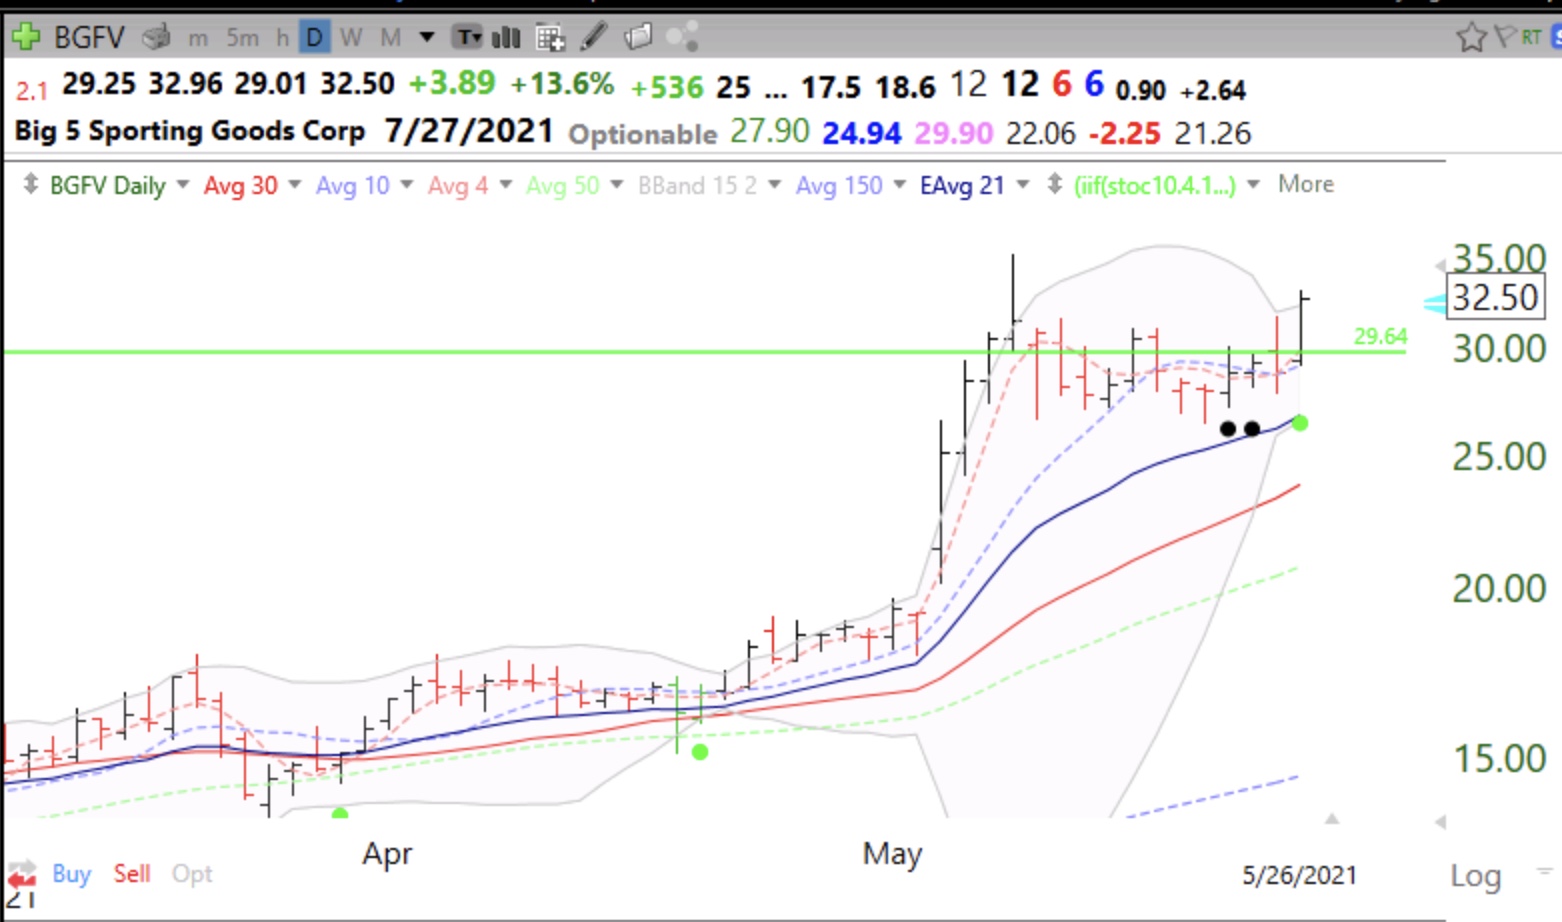
If I buy a stock after a GLB I sell it immediately if it closes back below its green line. A failed set-up on which I base my purchase must always be sold. It is preferable for the GLB to occur on above average weekly trading volume. This weekend I identified a few stocks that have met the above criteria last week or a few weeks before. Here are their charts.
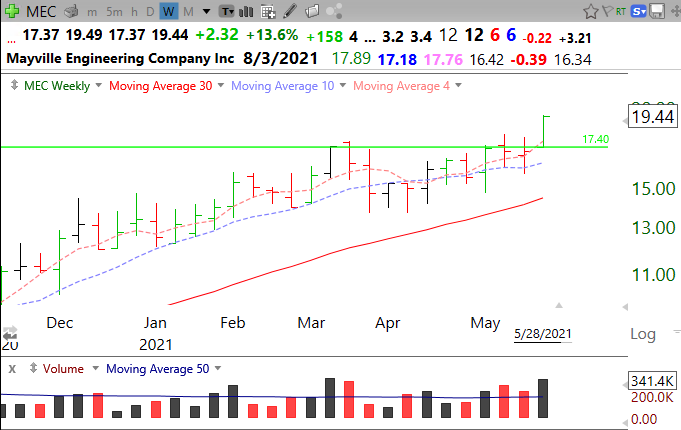
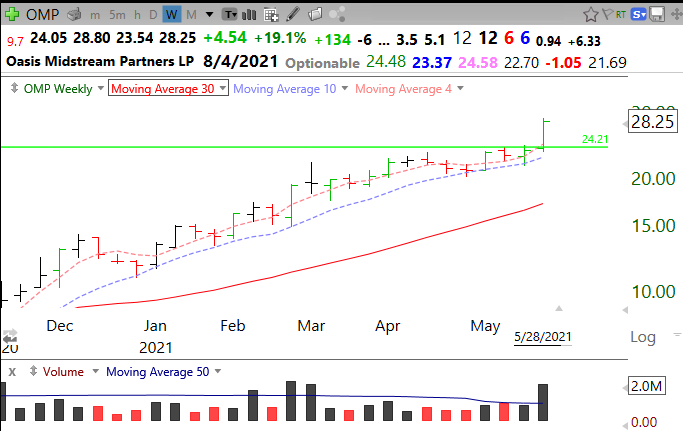
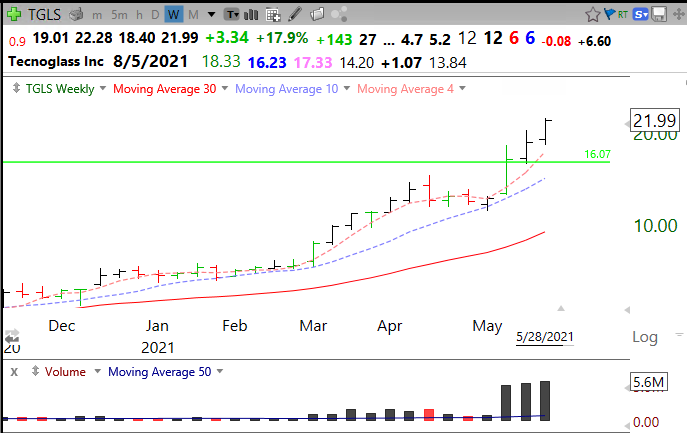
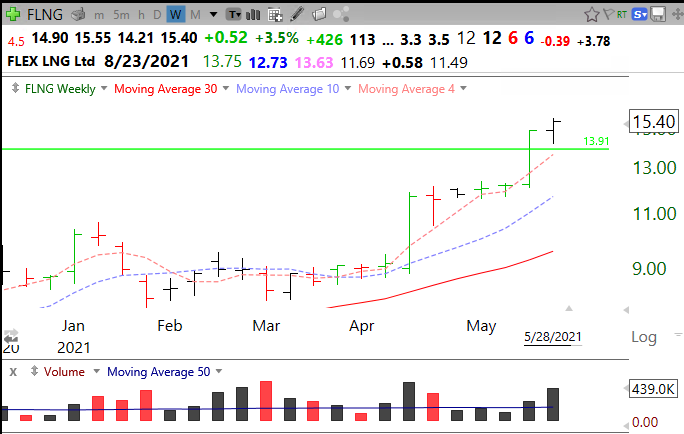
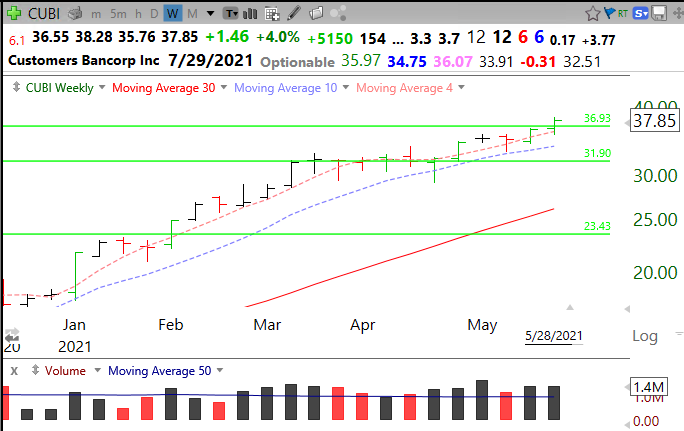
It is impossible to tell if any of these stocks’ GLB will fail or if it will rocket higher. I did look up their fundamentals on MarketSmith. Their IBD Composite scores are MEC (78) OMP (94) TGLS (99) FLNG (98) CUBI (99). All have floats of <30 million shares.
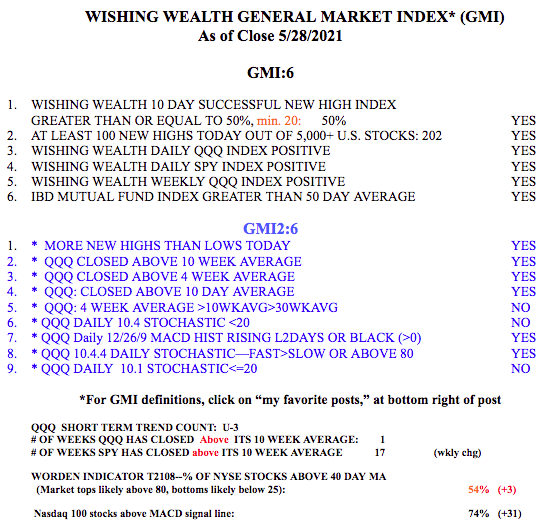
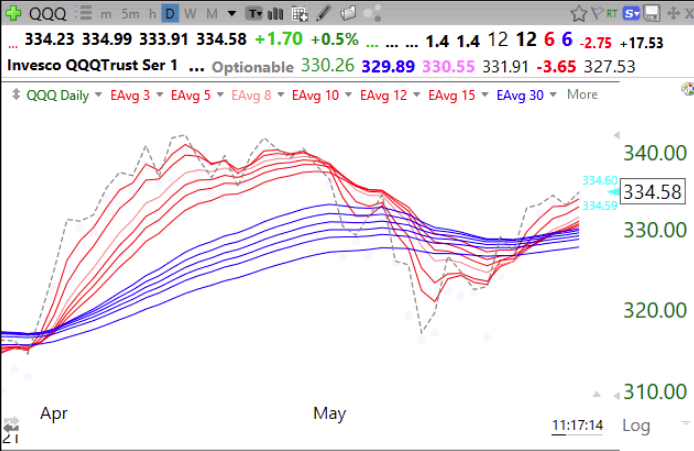
The GMI is 6 (of 6), flashed a Green signal, and the new QQQ short term up-trend has now reached 3 days (U-3). I have begun to purchase TQQQ, the 3X leveraged bullish ETF for QQQ. If this up-trend persists I believe this is where I will likely make the most $$$$. Note that QQQ has now closed back above its 10 week average while SPY has closed above its 10 week average for 17 straight weeks.