Blog Post: GMI turns RED; Day 6 of $QQQ short term down-trend; only 28% of NASDAQ 100 stocks closed above their 50 day averages; cash is king!

GMI2/6
GMI-21/9
T210828%

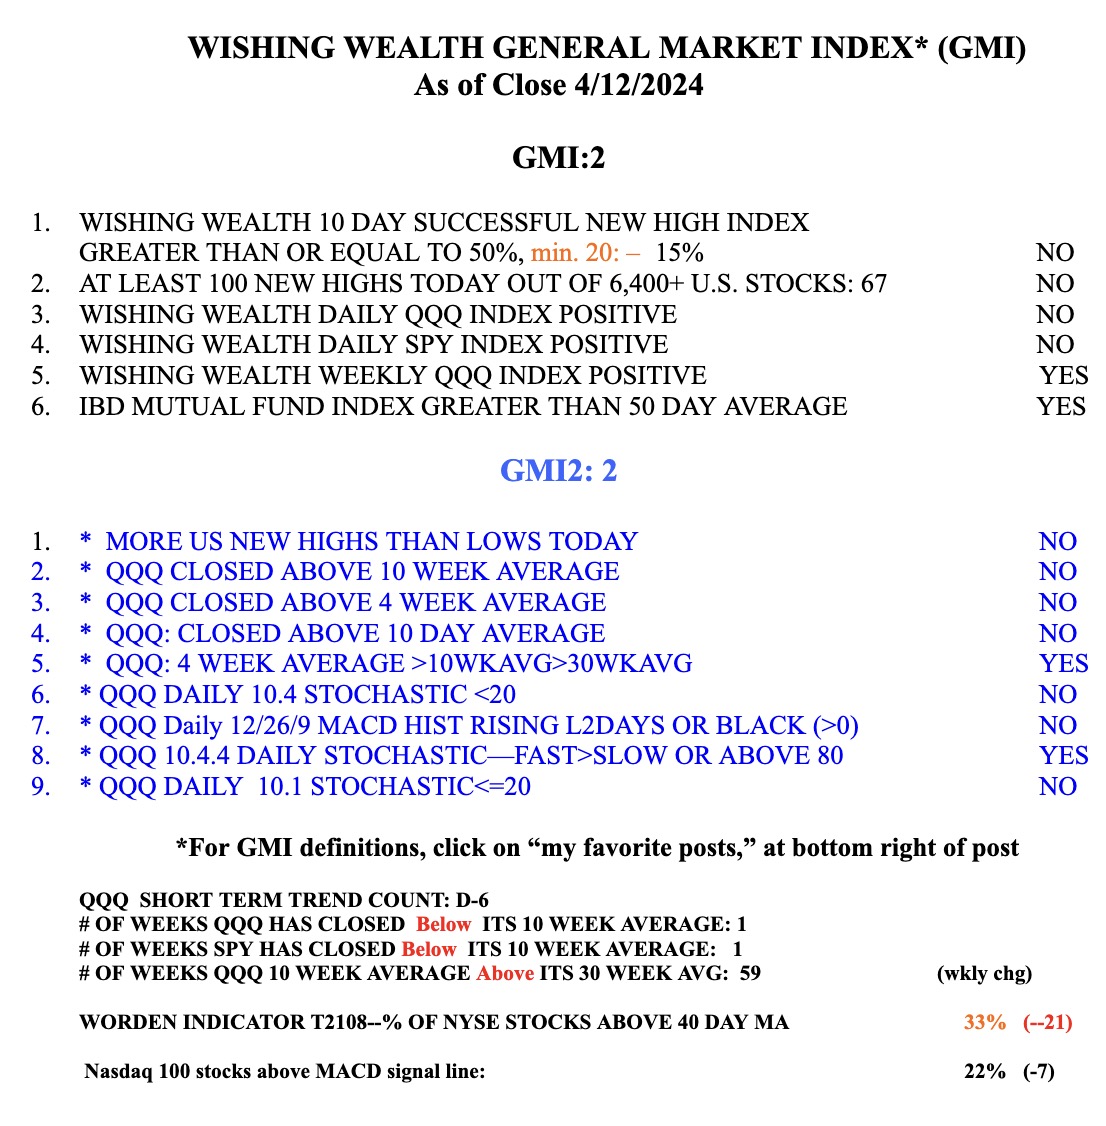
QQQ has broken below its recent support level on above average volume. DIA and SPY are equally weak. Support may be around 405 or the green line at 408. This is the time for me to be on the sidelines in my trading accounts. The longer term trend remains up but the GMI has turned RED. If the GMI hits zero, I will begin to transfer my conservative retirement funds from mutual funds into money market funds.

Screenshot

Blog Post: Day 6 of $QQQ short term down-trend; GMI=2; Will earnings save this market?

GMI2/6
GMI-22/9
T210833%

As I indicated in a tweet, @wishingwealth, intraday last Friday, I went to cash in my trading account. Too many breakouts have failed. GLD looked like it had experienced a high volume reversal. SPY and QQQ have now closed below their 10 week averages. Another weak day will turn the GMI to Red. I will wait to see if we get a strong earnings related bounce this week. This market is not acting well enough for me to take on long positions. Sell in May is almost upon us.

Screenshot

Blog Post: Day 5 of $QQQ short term down-trend that could end Friday; the GMI remains Green; $QQQ holds support and shows strength, and is in a nice weekly RWB up-trend and $AMZN has GLB, see charts; earnings release rally may have finally begun

GMI3/6
GMI-26/9
T210843%

Thus far, QQQ has held above last week’s low of 435.11 and has reclaimed its 4 and 10 week averages. My adapted weekly GMMA chart shows QQQ to remain in a sustained RWB up-trend. The dotted line represents each weekly close. The purple dots are the weekly lows. We want all the short term  (red) averages to rise above the longer term averages (blue) with a large white band separating them, hence the RWB pattern.

Screenshot

AMZN had a GLB on Thursday. I would have liked to see an increase in volume. AMZN must not close back below its green line, at 188.65.

Screenshot