The GMI remains on a Sell signal even as my short term trend indicator for the QQQ is in the second day (U-2) of an up-trend. A down day on Monday could change the short term trend for the QQQ back to down. The QQQ and SPY have now closed below their critical 10 week averages for 4 weeks.
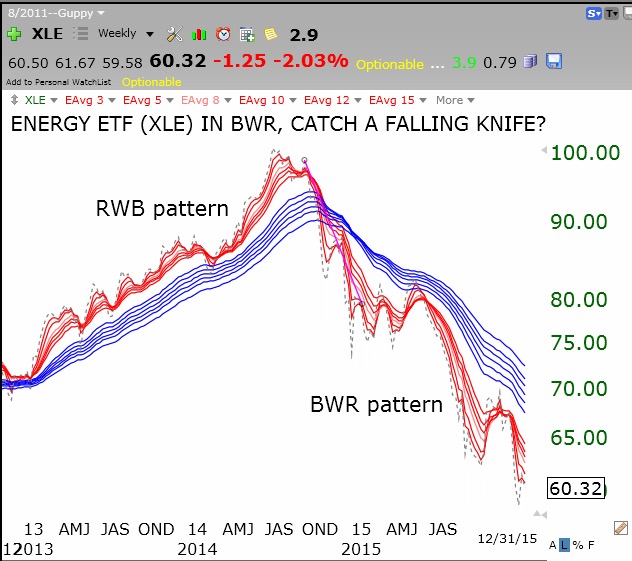
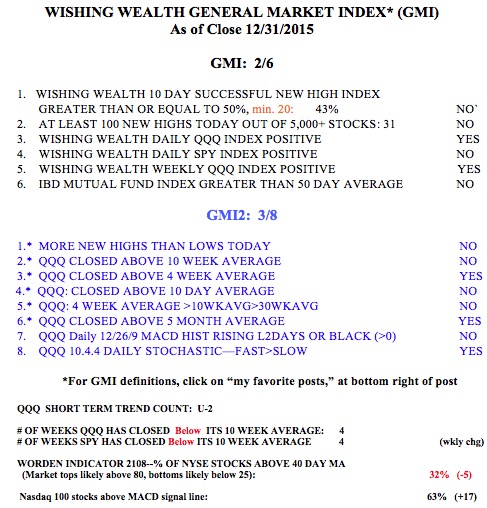 The GMMA charts which I have adapted clearly show the patterns of the major market indexes. When the six shorter term (red) averages are above the rising longer term averages (blue) with a white space between them we have a strong RWB up-trend. When the reverse is true we have a BWR down-trend.
It is clear that the Dow Transportation average is in a BWR down-trend. Note the strong RWB up-trend lasted for several years, through early 2015. We now have an ominous pattern for those who follow the Dow theory of the market.
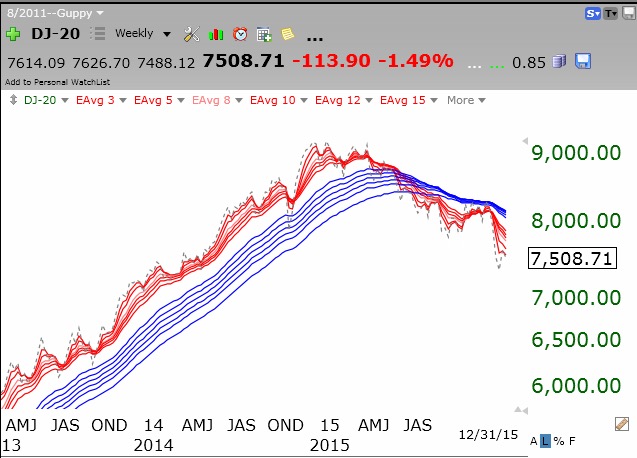 The Dow 30 index is no longer in an RWB up-trend, but a BWR pattern is not in place.
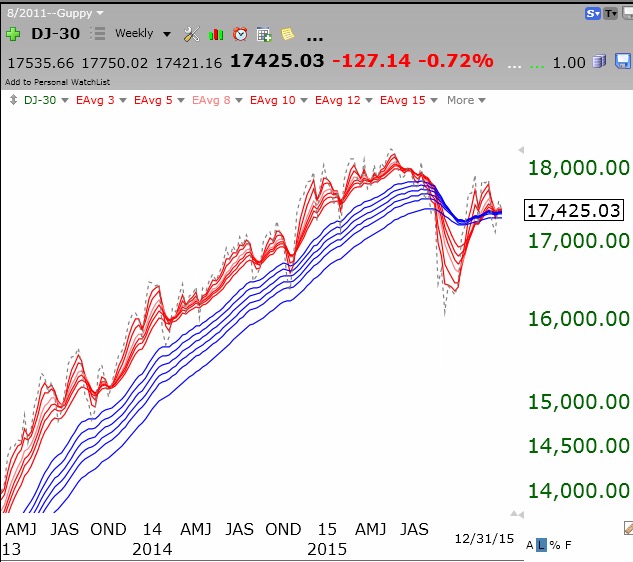 But the NYSE index is definitely in a BWR down-trend.
Perhaps the NYSE stocks are weighted down more by energy related stocks or multi-nationals. Look at the energy ETF, XLE. It is in a confirmed BWR down-trend. No one but a gambler would try to pick a bottom here. Look how clearly one can see in 2014 the change in trend from an RWB to a BWR pattern. I would never hold a long position in a stock or ETF in a BWR down-trend.
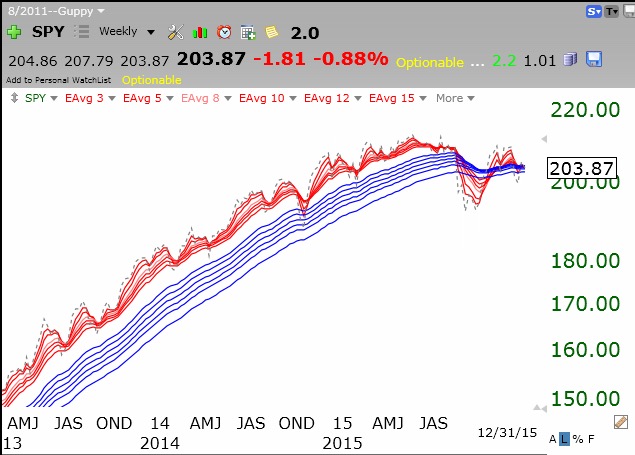
The SPY looks like the Dow 30 and has not transitioned into a BWR down-trend yet. But it does show the end of a multi-year BWR up-trend. How much easier (and more profitable) it is to hold stocks when the indexes are in strong RWB up-trends!
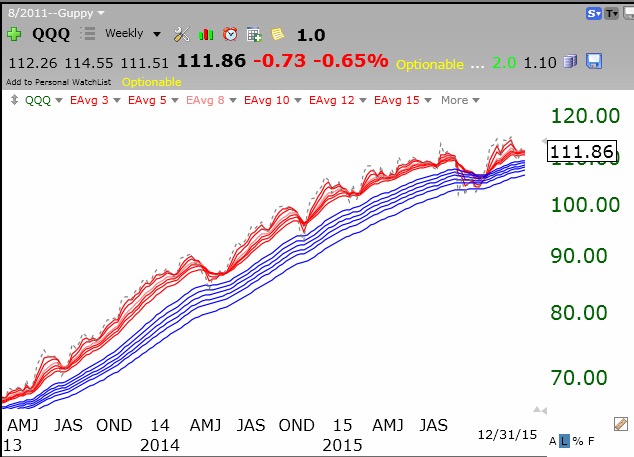
 The QQQ bearly? remains in an RWB up-trend.
 What does all of the above mean to me? We have a split market, with energy related stocks and multi-nationals weak but with tech stocks acting stronger. However, note that the QQQ failed to break through resistance last week, as this daily chart shows. (Click on to enlarge.)
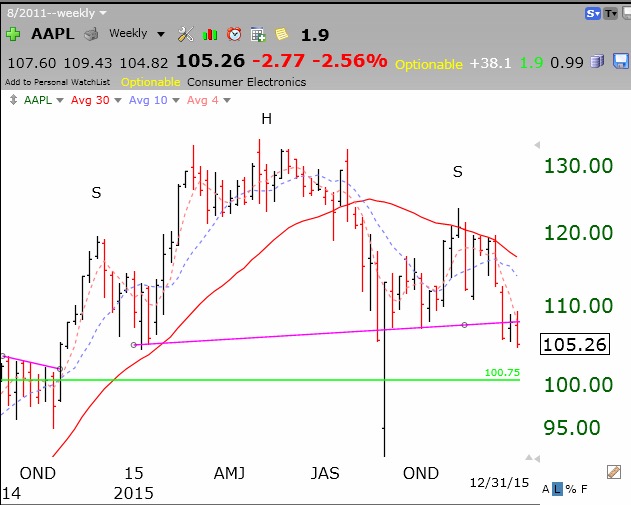
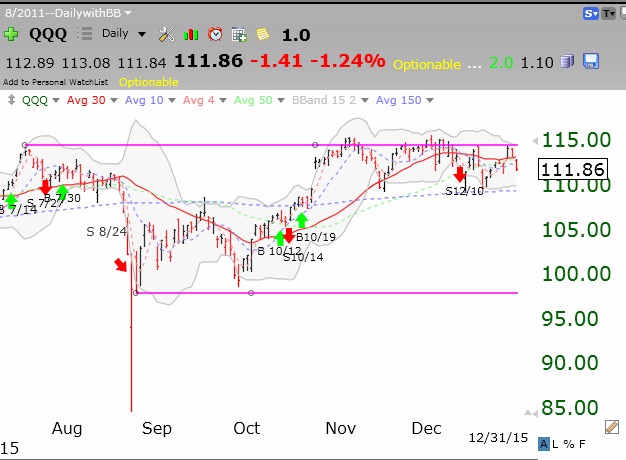 The QQQ, at 111.86, is now heading back down towards support, around 109. Will it hold, fail and re-test the lows around 98, or make another run at resistance near 114? The continuing weakness in the leader, AAPL, suggests to me more weakness in techs (and the whole market) lies ahead. This weekly chart shows that AAPL may have completed the head and shoulders top formation I have been posting about for weeks–very ominous, with a price objective around 80.
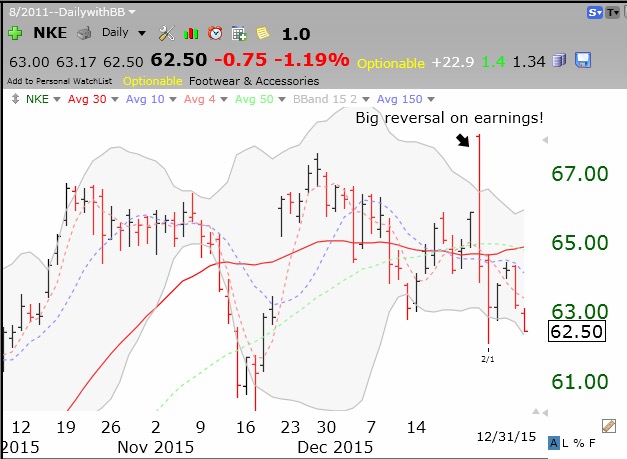
And NKE sold off after a good earnings report. When leaders cannot rise on good news, it is telling us something about the inner strength (or lack thereof) of the market. Check out this daily chart of NKE.
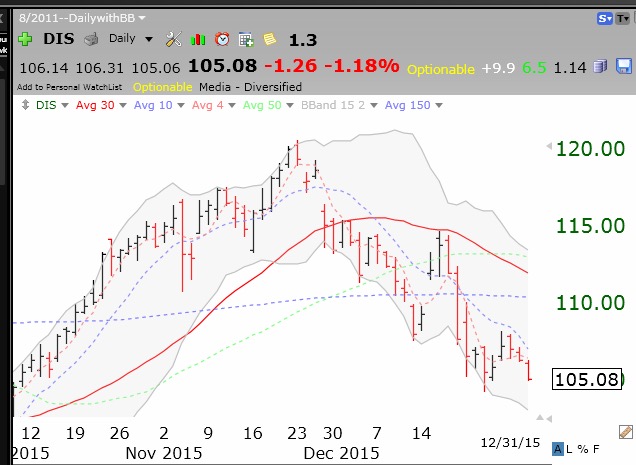
Even DIS, with the release of StarWars, could not get out of its own way. Check out this daily chart of DIS.
Is the bear already upon us? 2016 will tell the story……
Thanks for sharing a good analysis of the current market weakness.
Michael