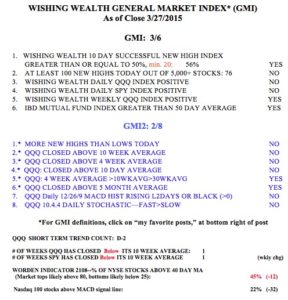
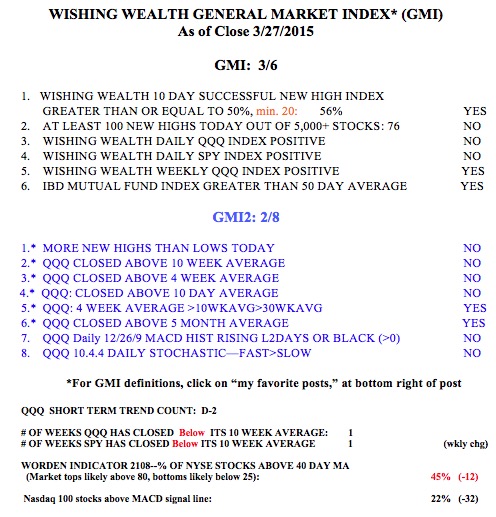
The GMI rose to 3 on Friday (see table below), keeping the January Buy signal in place. Nevertheless, Friday marked the second day of the new QQQ short term down-trend. A good many of these short term down-trends since 2006 lasted under 5 days. I think it likely that we have finished with the customary pre-earnings lull/decline period and that the market will rise as we move into first quarter earnings reporting.
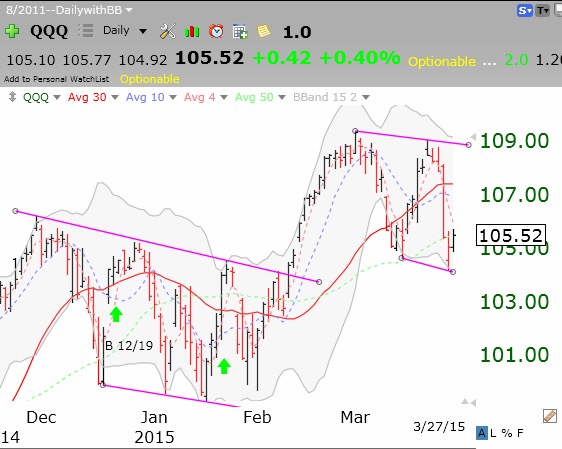
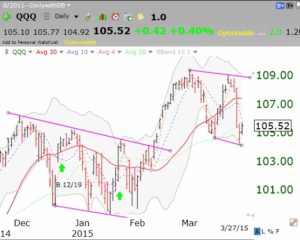
This daily chart of the QQQ suggests to me that the market may be in another trading range like the one we experienced in December and January. I have marked these ranges with trend lines. The market bounced on Thursday above its bottom daily 15.2 Bollinger Band. I would have liked a more oversold reading on its daily 10.4 stochastic- it only reached a low of 34. Thus, either the recent BB bounce will hold, or the QQQ will retreat again to an oversold stochastic, below 20. The market indexes tend to bounce back after the daily 10.4 stochastic declines to below 20. (Click on chart to enlarge.)
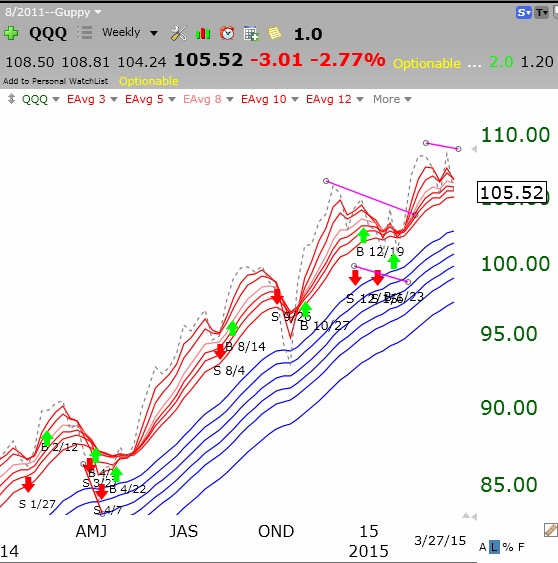
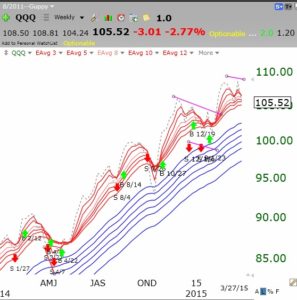
This weekly GMMA chart of the QQQ shows this index to be in a strong RWB up-trend.
With the GMI at 3 on Friday, my indicator remains on the Buy signal from late January.