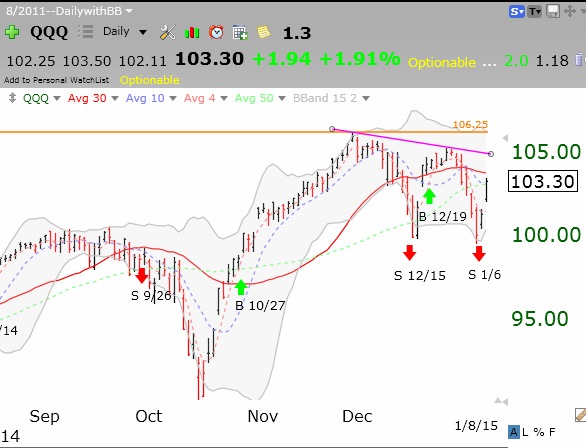
IBD has called the market back in an up-trend. Another up day could turn the GMI to a Buy signal. I have rarely seen such volatility. I did say that more than one half of QQQ short term down-trends have lasted under 10 days. This daily chart shows the recent GMI signals (by the arrows).
 I remain a little skeptical of whether this bounce will hold.
Could you please clarify the difference between the “QQQ short term downtrend” and the “GMI sell signal”? Also, any reason one is superior than the other?
Used to think they meant the same thing, but apparently they do not seem to be. You track the “QQQ short term downtrend” days count and have a statistical study around them. You also track the “GMI buy/sell signals” on the QQQ chart.
My QQQ short term trend count is extremely sensitive and gives me advance notice that the longer term trend may change. The GMI includes this short term trend as one component and includes longer term indicators too. I use both indicators to guide my trading.
Got it, thanks.
Since the ST trend provides advance notice, has it performed better than GMI?
They measure two different things for different trading scenarios.