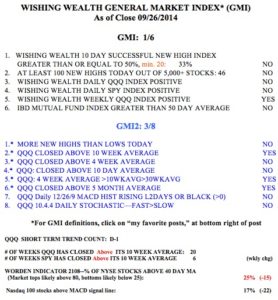
The GMI now registers 1 and flashed a Sell signal as of Friday’s close and my QQQ short term trend has turned down. Sometimes these changes in short term trend do not persist for more than a day or two, so I watch the market action very closely. There are a lot of other technical indicators that make me very cautious this week. The QQQ is sitting on its 10 week average. A weekly close below it (about 98) would be a significant sign of a weakening in the longer term trend. Failure of the bounce back above its daily 15.2 BB would be a serious sign of short term weakness. Both of these areas of support remain around 97.80-98. I always look for a close below important support levels before I act. I therefore restrict most of my daily trading to around 3:45 PM when I can estimate where things will close. If I trade earlier in the day I am often whipsawed by the action. IBD still sees the up-trend under pressure, another sign for me to be cautious. There were 46 new highs and 214 new lows on Friday, the opposite of what I would expect from a healthy rising market. Again, the action was different for tech stocks versus other stocks: 63% of all stocks rose Friday compared with 91% of the Nasdaq 100 non-financial tech stocks. On the plus side, the T2108 is now at 25%, closer to where bounces occur and the put/call ratios have been above 1 for two days……..
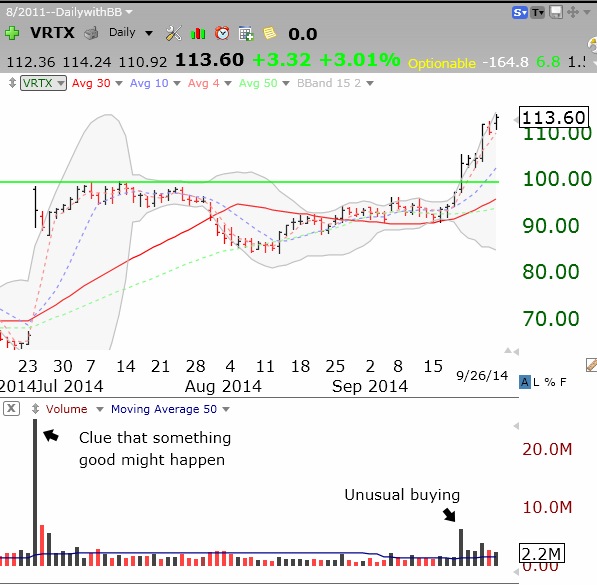
Four Nasdaq 100 stocks have a 15.4 daily stochastic above 80, representing recent price strength. They are VRTX, SIAL, FB, EBAY. While a reading above 80 is often considered over bought, strong stocks can remain at this level for long periods. The signal I watch for is a decline in the stochastic below 80 after being above for a number of days.
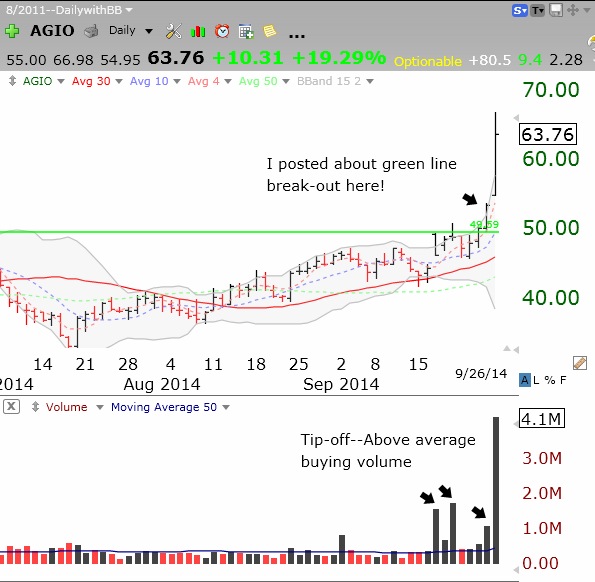
I don’t often nail a break-out, but did you see what AGIO did on Friday after I had posted about it Thursday night?

I had no inside information. I just let the technical indicators and the news alert me that something was up. I learned from my stock buddy, Judy, who picks a lot of biotech winners, that one can learn a lot by reading news reports about drug companies’ promising clinical trials and scheduled presentations. Being in the research field, I know that one schedules public presentations to highlight good research results. The astute reader might have read last week that AGIO has a big presentation coming up about their research on new drugs they are developing. And while it pains me to say it, Jim Cramer has been crowing about AGIO.
I run a TC2000 scan every night for bio-tech stocks that have advanced that day on unusually high volume. Then Judy goes to work researching them to uncover the gems. The unusual trading volume is a clue to finding bio-tech gems like AGIO and even VRTX before they take off. The exciting money to be made is in the revolution occurring in drug development.
 Now, I know that some of you are going to write me to request the stocks that came up in my bio-tech scan from last night. If I listed the stocks, I suspect some people would just buy them and not do the due diligence to uncover the probable winners. And this, even though the market up-trend is in doubt! The scan did uncover 7 stocks (XXXX, XXXX, XXXX, XXXX, XXXX, XXXX, XXXX). You will just have to stay tuned to see if I write about them–after doing the necessary research. I maintain a growing watch list of all stocks that have recently been detected by this bio-tech scan. I monitor them over time for signs of strength and news….
This week is critical for telling me the market’s probable trend. So I am unlikely to buy anything right now. Will Friday’s rebound hold???