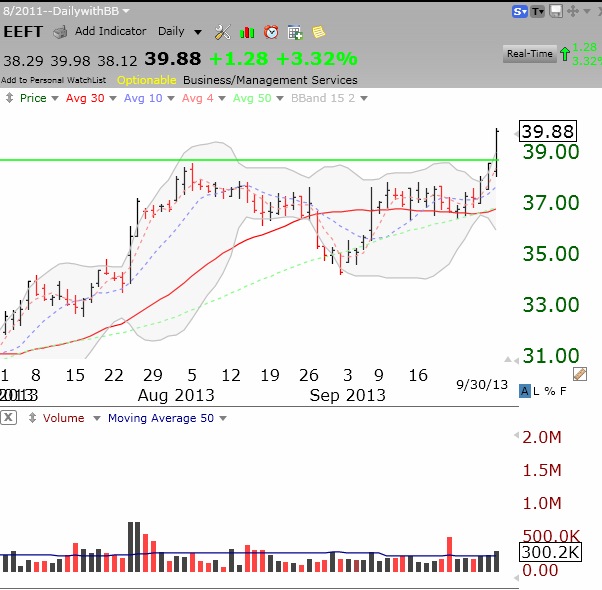
Short and longer term trends remain up. TC2000 sent me an alert of a green line break-out for EEFT. It had above average volume on Monday. Check out this daily chart.
Stock Market Technical Indicators & Analysis
Short and longer term trends remain up. TC2000 sent me an alert of a green line break-out for EEFT. It had above average volume on Monday. Check out this daily chart.
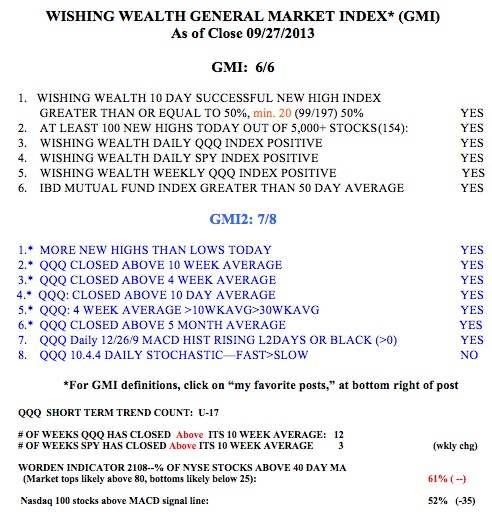
The GMI remians at 6 (of 6) and the Worden T2108 is in neutral territory, at 61%. The QQQ short term up-trend is only 17 days old. This up-trend may have a while to go. Last week was end-of-quarter window dressing when the mutual funds buy the winners so their portfolios look smart in their quarterly reports. Hence a lot of the winners like TSLA and FB were strong. This week there could be some retracement while we wait for the 3rd quarter earnings to be released. The markets could also be hit by the fighting going on in Congress.
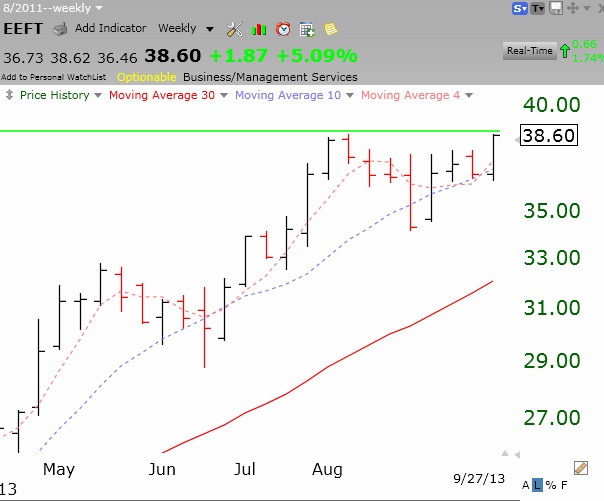
Meanwhile, here are some interesting charts to think about. This weekly chart of EEFT shows that it is very close to a green line break-out and could be watched for a high volume push to new all-time highs next week.
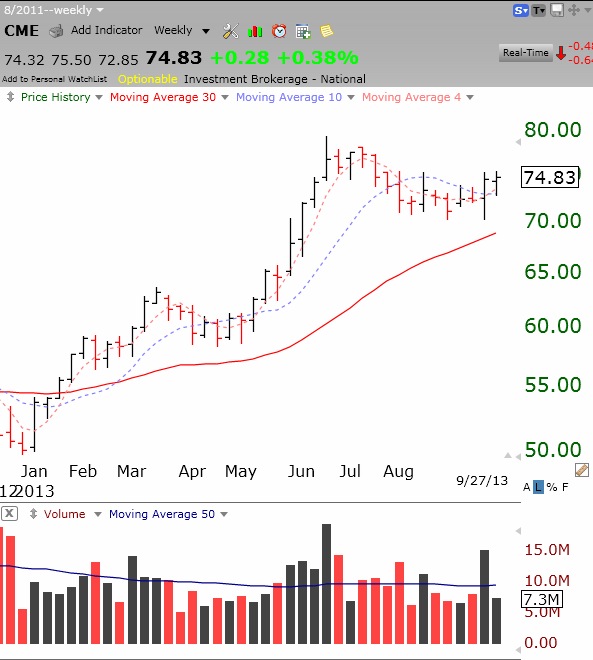
CME also caught my attention. It is far below its green line (around $143) but it may be gaining strength. It is now above its 10 week average and is clearly in a Stage 2 up-trend. It has been consolidating the past 14 weeks after a high volume advance.
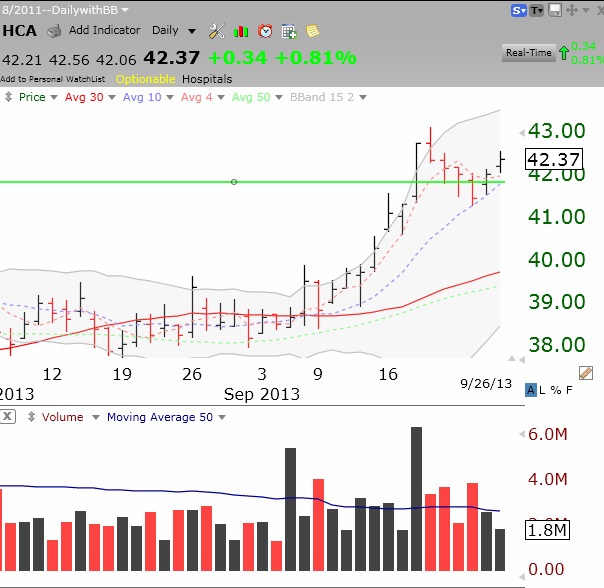
So many of the green line break-out stocks have done well. Just note FB, CTRP, WYNN, CVLT, ROST. I have traded all of them. Other stocks of interest that recently broke their green line top include: MDAS, TNGO, TAL, GWR, MSCI, HCA, BIIB, ASGN. Check them out. This daily chart shows that HCA just re-tested its green line top. Note the volume spike at the original break-out.