While the GMI has flashed a Sell signal, I am waiting a few more days to see if its technical components weaken or snap back. For now I am mainly in cash and a little short in my trading accounts. Thursday was the second day of the new QQQ short term down-trend, but it could reverse with a strong day on Friday.
Month: August 2013
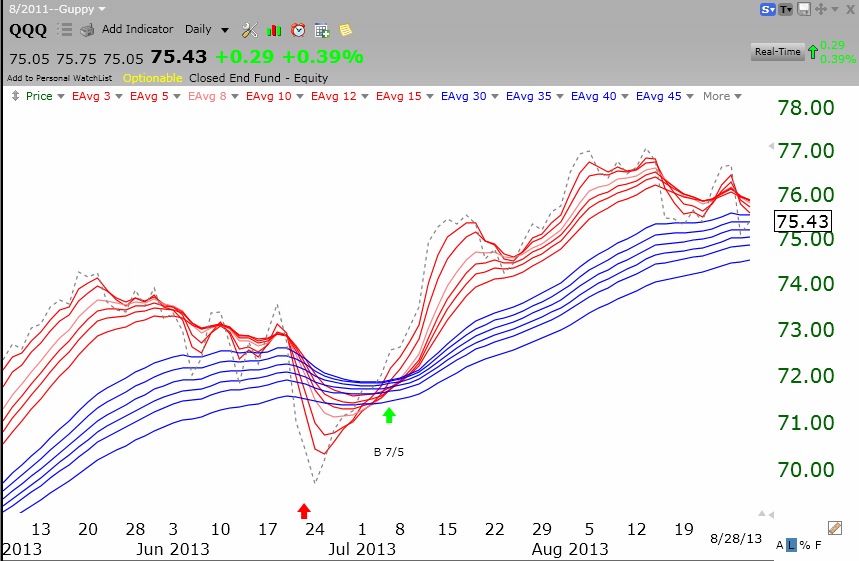
New QQQ short term down-trend; GMI=2; Guppy chart reveals decline
The QQQ short term up-trend has ended. I usually have confidence in a change in the short tern trend when it reaches the 5th day. So, I bought a little SQQQ and will add more if the down-trend persists. The Worden T2108 is at 26%, getting close to over-sold territory, however. This daily Guppy chart of the QQQ shows that all of the shorter averages (red lines) have turned down and are now converging with the longer averages (blue lines). In a strong up-trend there is a white band between the two, yielding a red white and blue pattern. Time will tell how steep this decline will be. One more day with the GMI below 3 will cause a more significant Sell signal.
Market reverses-QQQ short term up-trend in doubt
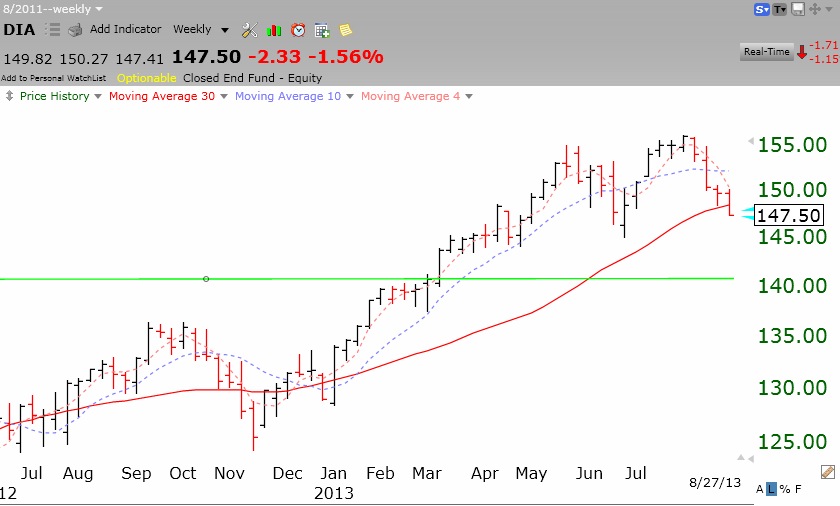
I moved to a largely defensive position on Tuesday. The QQQ short term trend could turn down today if the index does not rebound strongly. The DIA (Dow 30 ETF) looks much worse than the QQQ and the SPY. The DIA is now below its 30 week average, a sign of major weakness. Check out this weekly chart and compare it to the one of the QQQ I posted earlier this week. If the red line (30 week average) curves down, it is a very ominous signal. The GMI could also issue a Sell signal this week if it has 2 days below 3.