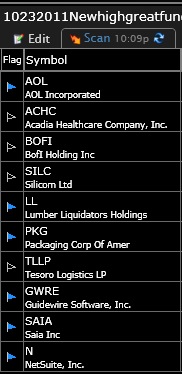
First, thanks to all who encouraged me to continue posting scans. Please keep in mind I do this as an educational exercise and not to provide specific recommendations. One should review my results, research the companies and make a decision whether any company fits your trading model and risk tolerance level…..
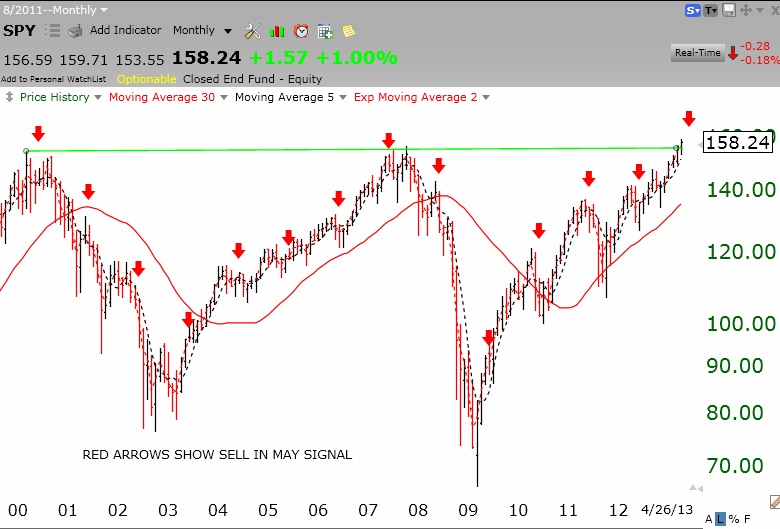
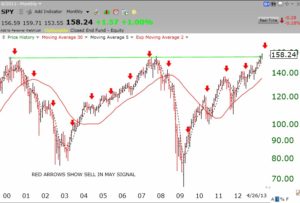
As you May know (pun intended!), there have been analyses done with markets around the world showing that for some reason, markets are weaker in the period from May through October than in the rest of the year. One could get most of the gains with less risk by being in the market only from Halloween through April each year. Hence the mantra, Sell in May and Go Away. These sayings may have utility in timing the market merely if many people follow them. The monthly chart below of the SPY shows how the market performed after the month of May each year since 2000. There are 13 signals, not including the coming May. In all but two years, the market showed weakness in the period after May. The exceptions, in 2003 and 2009, came after large bear market declines. So it may be that this year we will get weakness from May on since we are not coming back from a steep recent decline. To the contrary, the SPY has had a recent green line break-out to an all-time high.
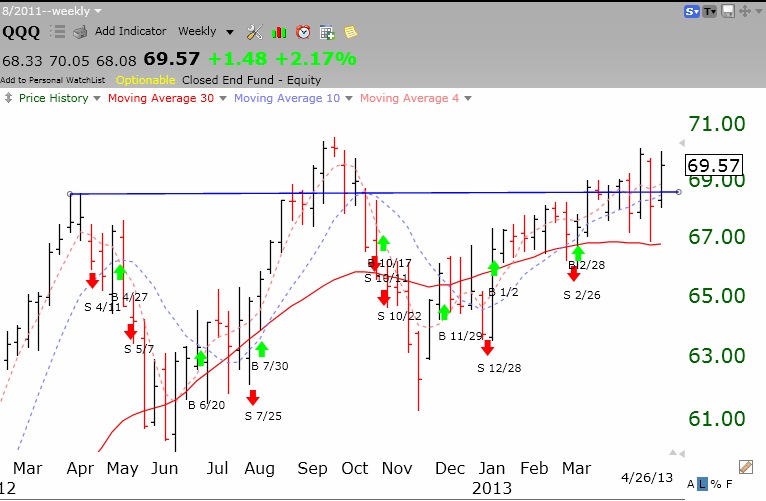
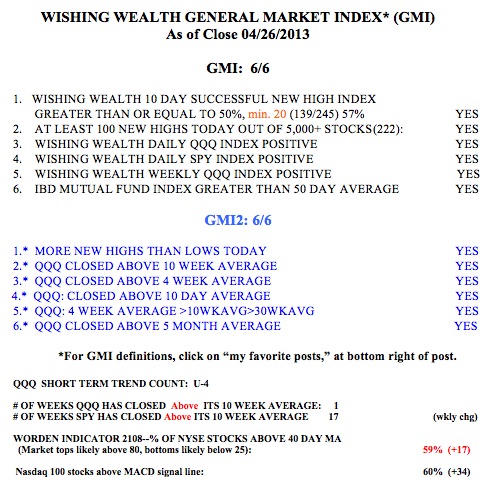
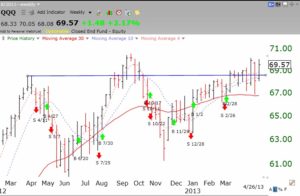
Meanwhile, IBD says the market is still in a correction while the GMI remains a strong 6 (of 6). The Naadaq 100 Index, as this weekly chart of the QQQ ETF shows, has now rebounded, yet again, above its 10 week average. It looks to me like we are either putting in a double top or setting up for a substantial break-out. The GMI buy signal from late February remains in effect (see GMI table below). Stay tuned…
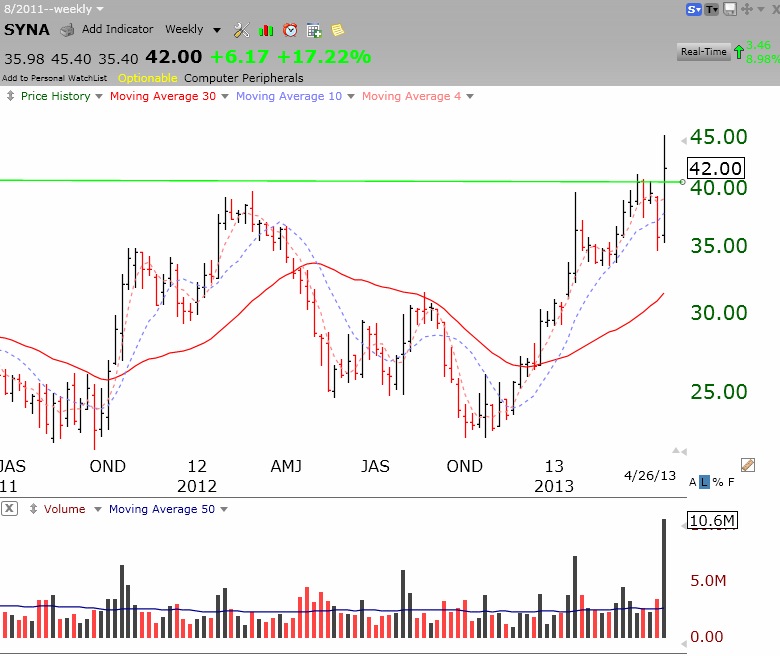
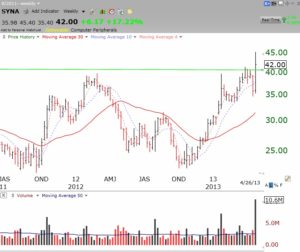
SYNA came up in one of my scans. It released terrific earnings on Thursday and gapped open to an all-time high on Friday, as evidenced by the green line break out on its weekly chart below. It broke a high reached in November, 2007 on the highest weekly volume since 2009. It remains to be seen whether this is the start of a substantial move up.
Two other recent green line break-outs also came up in my scan: CERN and TRIP. Check them out!