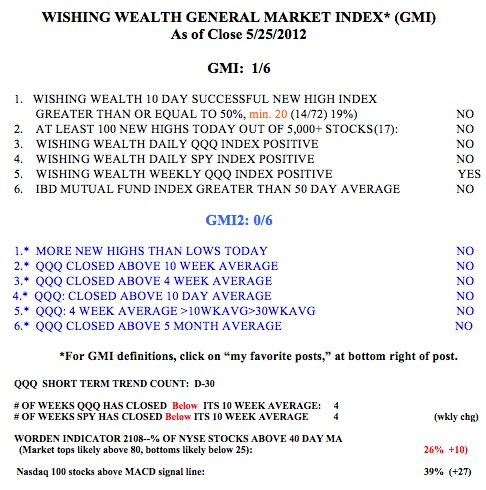
The GMI is back to 1. It does not pay to try to ride counter-trend bounces. Better to be short or in cash. Since the current short term down-trend in the QQQ began on April 16, the QQQ has declined -4.8%. During that time 77% of the Nasdaq 100 stocks have declined. However, 14 stocks did rise 5% or more. What are the chances one would have known to just hold or buy those 14 stocks? Almost 5x as many (61%) of the Nasdaq 100 stocks declined 5% or more. Those are pretty bad odds for profiting by going long. During this period, QID rose almost 9% and SQQQ almost +13%. Again we learn that the best approach is to buy a leveraged ETF that tracks the Nasdaq 100 index as soon as a change in the short term trend is identified. When the next QQQ short term up-trend begins, I will buy QLD or TQQQ and announce it in a post.
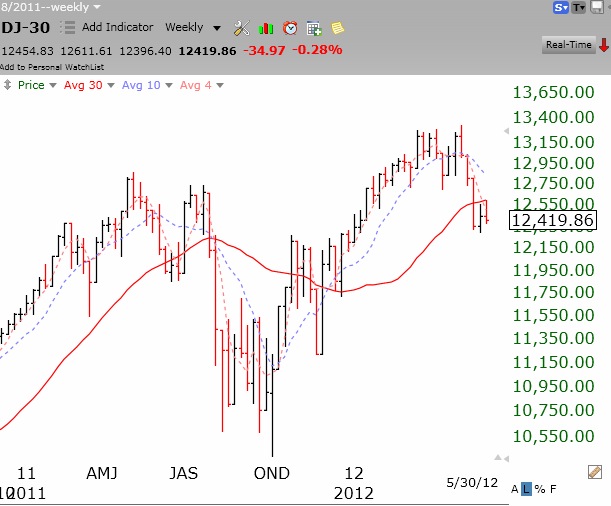
Meanwhile, this weekly chart of the Dow 30 shows that the index is below its 30 week average (red line) a possible sign of a beginning Stage 4 decline. The S&P500 index has a similar pattern. Only the QQQ remains above its 30 week average, reflecting greater relative strength in the nonfinancial tech stocks. If the QQQ comes back below its 30 week average I will start to go to cash in my university pension.