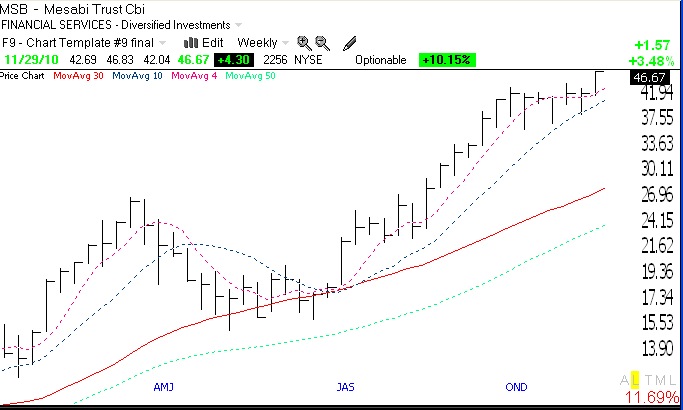
The QQQQ short term up-trend completed its 6th day on Monday. However, there were only 99 new 52 week highs in my universe of 4,000 stocks. One of the new highs was RWB rocket stock MSB, that broke out of its 6 week consolidation. A weekly chart of MSB appears below. Click on chart to enlarge.
Month: November 2010
QQQQ short term up-trend completes 5th day; Majority of advisers bullish; RWB rocket: SPRD
On Friday, the new QQQQ short term up-trend completed its 5th day. Usually, once an up-trend turns 5, it lasts quite a bit longer. But the GMI is only 4, reflecting some weakness in the S&P500 (SPY) stocks. I am also a little concerned by the fact that the Investor’s Intelligence Survey on last Tuesday showed 55.7% of advisers being bullish on the market. This is a good contrary indicator, and in the past when the bullish percentage approached 60%, the market was near a top. So, we need to watch this survey and the market very closely. 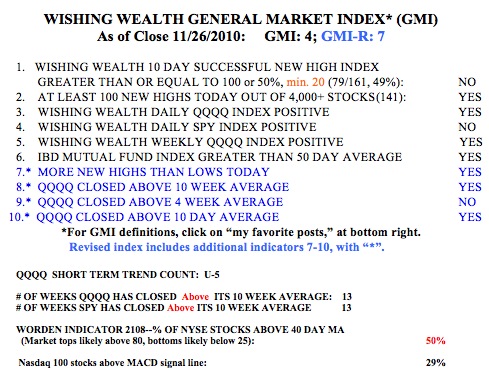 The QQQQ and SPY have closed above their 10 week averages for 13 straight weeks. I have found that as long as the QQQQ closes above its 10 week average, I can trade the tech stocks profitably. So, this is another indicator I monitor. The Worden T2108 indicator is at 50%, in neutral territory. The percentage of Nasdaq100 (QQQQ) stocks closing with their MACD above its signal line more than doubled last week, to 29%. This is a sign of short term strength. The GMI is now at 4 (of 6), and the more sensitive GMI-R is at 7 (of 10, click on Table to enlarge).
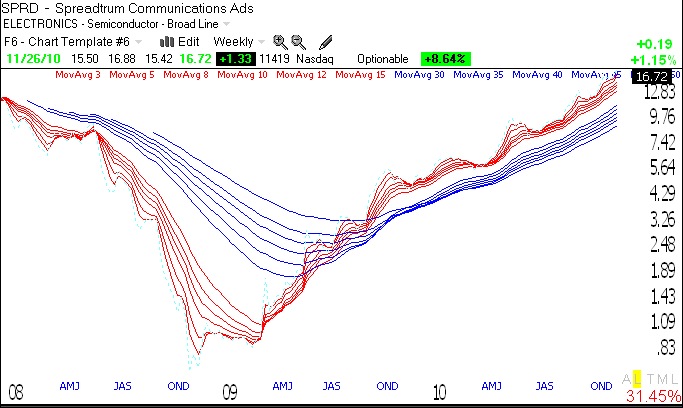
Below is a weekly GMMA chart of another RWB rocket stock, SPRD. All of the short term averages (red) are well above the rising longer term averages (blue). SPRD is close to its all-time high of $17 reached in November, 2007. A close above $17 would be a sign of strength for me and a potential buy signal, if I were interested in acquiring it.
GMI back to 5 (of 6); QQQQ short term up-trend reaches 4th day; ARMH rebounding?
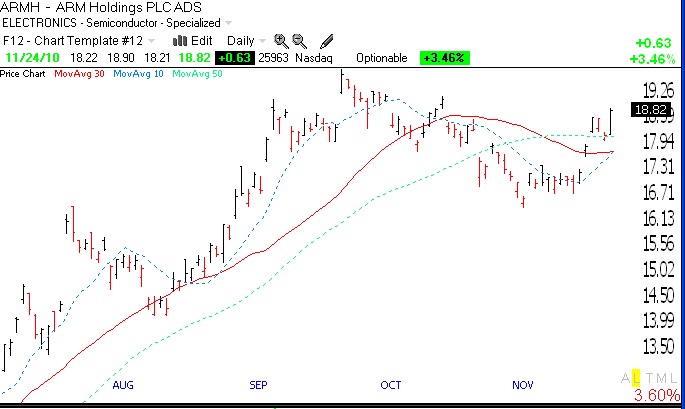
I have to relearn the lesson from time-to-time that I should not try to anticipate a change in trend, but to wait for the signal. Just when it looked like the new QQQQ short term up-trend would expire, it reasserted itself. Generally, if a new up-trend can reach 5 days, it has legs to continue. And so the leaders took off again. Leading stocks like AAPL, AMZN, TTM, APKT, CAVM, CTXS, RVBD, HANS and FFIV all advanced nicely. I own some of these. I am also keeping an eye on ARMH. ARMH looks like it may have completed its consolidation. Take a look at this daily chart (click on to enlarge). ARMH broke above its 50 day average (green dotted line) and its 30 day average (red line), and the 10 day average (blue dotted line) is rising above the 30 day.
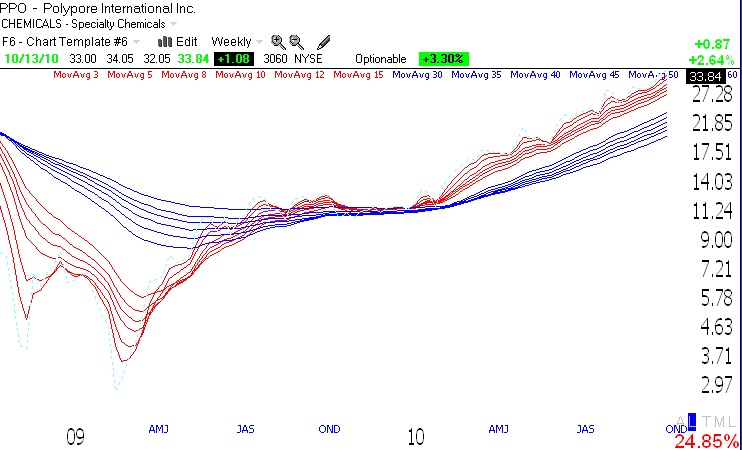
Note also that the GMMA weekly chart below shows the RWB pattern typical of rocket stocks. The short term averages (red) are well above the rising long term averages (blue). I only buy stocks that have monthly, weekly AND daily up-trends in place.
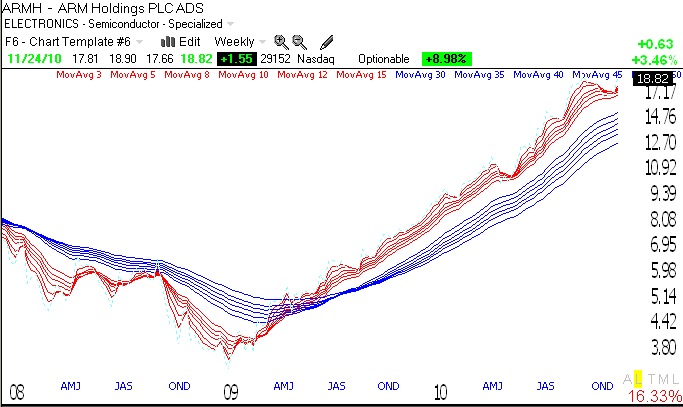 I am keeping an eye on ARMH.