GMI-1; GMI-R: 3; RICK- a stock for a “bare” market?

The GMI is now 1 and the GMI-R is at 3. (Click on chart to enlarge.)  The lack of major movement in the market can be seen in the fact that there were only 12 new highs and 42 new lows  in my universe of 4,000 stocks on Friday. Gmi0328
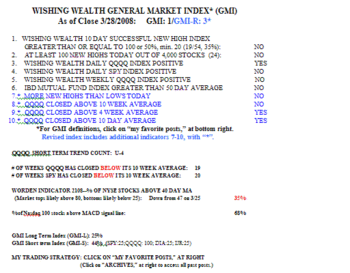
A growth stock strategy of buying stocks at new highs will not work in an environment when only 12 stocks out of 4,000 can hit a new high in a day.  The QQQQ has remained below its 10 week average for most of the past 19 weeks, and the SPY, for 20 weeks.  I have learned that my strategy of buying rockets going to new highs works best when the averages are consistently above their 10 week averages.  While the QQQQ remains in the fourth day of its short term up-trend, this up-trend is in jeopardy.  The QQQQ is only.21 above my key support level.  If it fails to close above this level today, I will begin to close out my few long positions and go back to cash.  The SPY (S&P 500 ETF) and DIA (Dow 30 ETF) have already broken down.  My indicators get me out of declining markets fast.  This market could be getting ready to create a whole new leg down and I am a chicken.  The key is to conserve capital in order to be ready for the next real up-trend, which can last for months.  It is not a good time to be scared into the market by the pundits who say that we will miss the next rise.  A worthwhile rise will provide plenty of time to get aboard………

It has been said that during a recession, the sin (SAG?) stocks (Sex, Alcohol, Gambling) tend to buck a down-trend.  Human beings will probably give up their lattes long before they abandon these other vices.  So I was amused when my TC2007  scan of the market for winners identified RICK.  Rick runs upscale adult nightclubs for "businessmen and professionals" reminiscent of the old Playboy clubs. Rick
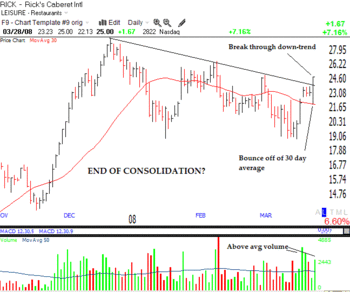
In addition to providing  adult entertainment, RICK also operates adult entertainment internet websites catering to people with, shall we say, diverse tastes. This daily chart of RICK (click on to enlarge) shows why I think it may be interesting to watch.  After doubling  in one month in December 2007, the stock consolidated and formed a nice downward trend.  Last Friday the trend line was broken on above average volume.  Some pundits have  suggested that Elliot Spitzer would have done much better to have invested his $80,000 in RICK, which rose as much as 30 fold since 2003.  If I decide to buy this stock during a possible recession, maybe I should visit one of Rick’s Cabarets and check out some of the company’s assets, and their bottom line…..

Newdisclaimer

GMI: 2; GMI-R: 5; 3rd day of QQQQ up-trend; CPST rises

The GMI and GMI-R each fell one on Thursday.  There were 33 new highs and 31 new lows in my universe of 4,000 stocks on Thursday.  Thursday was the 3rd day in the current short term QQQQ up-trend.  With the DIA and SPY under pressure I am holding off accumulating any more stocks until I see whether the QQQQ can hold its up-trend. CPST held up nicely on Thursday, rising 4.3% on above average volume (see yesterday’s post).

GMI: 3; GMI-R: 6; Day 2 of QQQQ up-trend; CPST–a Judy’s pick

The GMI is still 3 (of 6) but the GMI-R fell one, to 6 (of 10).  This is because there were  only 27 new highs and 28 new lows in my universe of 4,000 stocks on Wednesday.  The indicators in the GMI have kept me out of all major market declines since 1995,  including the bad markets of 2001-2002.  I then got back in the market in 2003  and my account was up over 50% that year.  I also avoided the decline that began last January, which lasted 55 days.  The new QQQQ short term up-trend is in its second day and I am beginning to wade into this market slowly by buying QLD and writing some covered calls.  If this up-trend should end quickly, I will get out and go immediately to cash again.  There is always time to catch a real up-trend that can last months……. 

The service that I use to scan stocks for writing covered calls is at www.poweropt.com. I like this service because I can narrow down my scan to include only IBD100 stocks.  The IBD100 stocks include the strongest stocks based on fundamentals and technical action as assessed by IBD.  I also eliminate stocks that will report earnings during the option period.  I was burned several times by writing covered calls on stocks that announced earnings and then plunged.  In a market up-trend writing calls on growth stocks with large premiums is the easiest and least stressful way I have ever made money in the market. Joseph Hooper’s book educated me about this new way to look at writing covered calls for income. While I do not follow his method of stocks selection and technical analysis, I do like his philosophy of writing near month covered calls for 3-5% income each month.  I do all of this trading in my IRA and do not have to worry about taxes.  Check it out…

My friend Judy, who is the best stock picker I have met, buys stocks based on concepts long before the technical action meets my requirements. Cpst
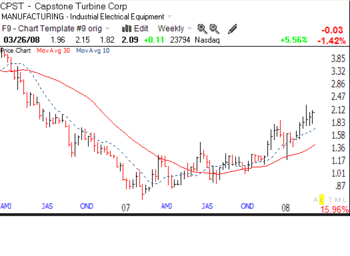
When she told me about this stock that she bought for about $1 per share, I told her I do not buy cheapies. But the stock has been rising, so I bought some around $2.09.  CPST makes microturbine engines and appears to be getting a lot of contracts.  If Judy likes a concept, it is good enough for me–as long as the chart looks good.  This weekly chart shows that CPST is now holding well above  its rising 10 week average (dotted line), which in turn is above its rising 30 week average (red line).  As long as the stock holds above this dotted line, now at 1.73, I will hold the stock.  This is not a recommendation, just an example of the chart pattern I look for and how I limit my risk.  By the way, most recent volume spikes are occurring on up weeks, suggesting strong buying. So, again, Judy buys at a price much lower than I do… 

Newdisclaimer