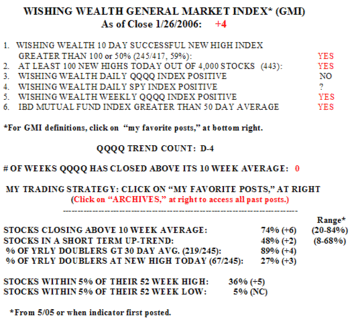
The GMI returned to a maximum +6 on Friday. But I am worried we are near a top. There were a record 630 yearly highs in my universe of 4,000 stocks. This was the highest since 629 on July 11. 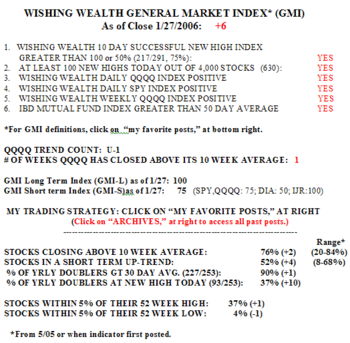 90% of the stocks that doubled in the past year are above their 30 day averages and 37% of them hit a yearly high on Friday. In fact, 37% of all stocks are within 5% of a new high. How much stronger can things get?
I think I erred in including both short and long term indicators in the GMI because these trends often differ. And I typically keep my university pension funds invested in a mutual fund as long as these long term indicators are positive. But my trading account goes in and out of the market with the trend of the shorter term indicators. So which indicator I follow depends upon my objectives. I therefore have split the GMI into a short term (GMI-S )and a long term indicator (GMI-L). I am also retaining the original GMI for consistency reasons. The two new indicators each count 16 short or long term indicators, four each for the DIA, QQQQ, SPY and the IJR. The GMI -L is now 100, meaning that 100% of the 16 longer term indicators are positive. However, the GMI-S is 75, indicating that three quarters of the 16 short term indicators are positive (50% for the DIA, 75% for the SPY and QQQQ and 100% for the IJR small cap stocks). I intend to update the GMI-L and the GMI-S as they change.
The WPM also shows the strength in the small cap stocks. 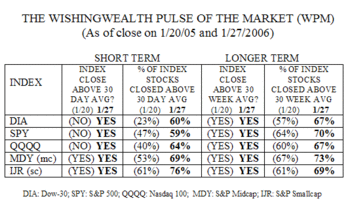 All five indexes are back above their 30 day and 30 week averages. The majority of the stocks that make up these indexes also closed above their 30 day and 30 week averages, with the small caps being the strongest.
In addition to my caution stemming from the extreme strength in all of my indicators, I am concerned that the market leaders, AAPL and GOOG, are relatively weak. The 100% first day increase in the Chipotle IPO (CMG) suggests to me that speculation is alive and well. I will feel much more confident if the indexes can surpass their mid-January peaks. If this rally stalls out before then, look out below.
Please send your comments to: silentknight@wishingwealthblog.com.
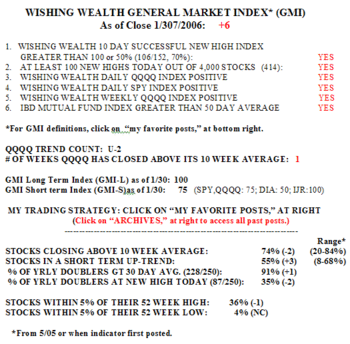 The number of new highs declined to 414. Only 40% of the Nasdaq 100 stocks rose, along with 42% of the S&P 500 stocks, 33% of the Dow 30 stocks and 44% of the S&P 600 small cap stocks. There were no changes in the GMI-L or GMI-S. Monday was the second day in the QQQQ short term up trend (U-2)…..
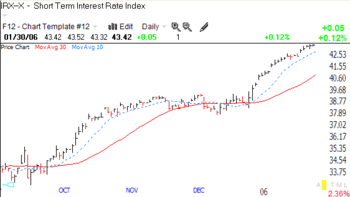 Also, the chart of the short term interest rate index shows that traders see no end in sight to the rise in rates. The Fed will surely accommodate them on Tuesday. I would be much more optimistic about this market if the QQQQ could take out its January 11 peak.

